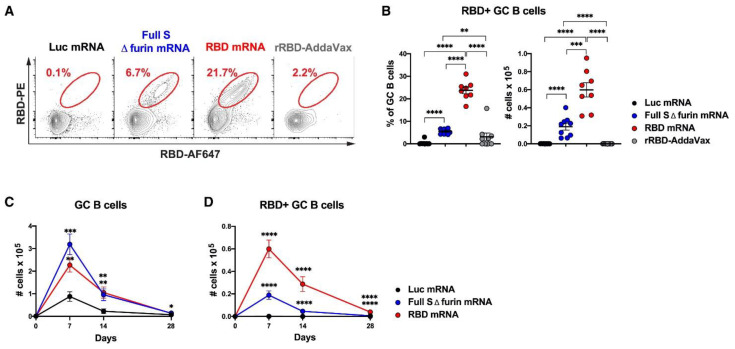
Figure 3.
Antigenic response after intravenous administration of SARS-CoV-2 mRNA vaccine. (A) Flow cytometry counts of RBD-specific GC B cells. (B) Frequency and absolute number of cells after 7 days of immunization. (C) Kinetics of the absolute number of cells. (D) Curves of absolute cell numbers versus time [135]. * p ≤ 0.05, ** p ≤ 0.01, *** p ≤ 0.001, **** p ≤ 0.0001.

