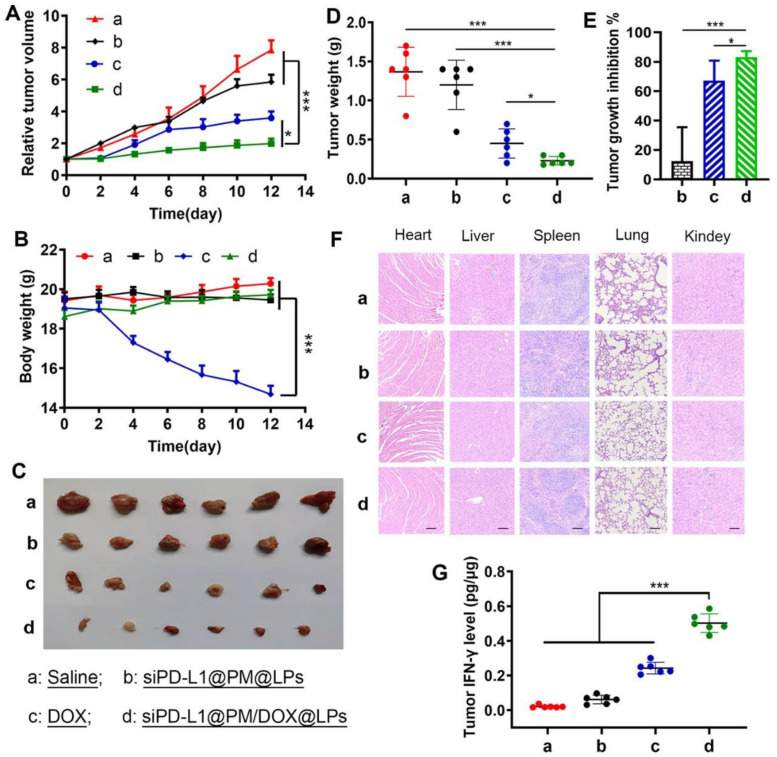
Figure 5.
Antitumor effects in vivo ((a) saline; (b) siPD-L1@PM@LPs; (c) free DOX; and (d) siPD-L1@PM/DOX@LPs). (A) Tumor growth curve. (B) Weight change during the experiment. (C) Pictures of tumor tissues isolated after the completion of the experiment. (D) Tumor weight change curve with time. (E) Tumor growth inhibition rate under different conditions. (F) H&E stain images of major organs (scale bar: 50 μm). (G) Levels of cytokine IFN-γ in tumor tissues [199]. * p ≤ 0.05, *** p ≤ 0.001.

