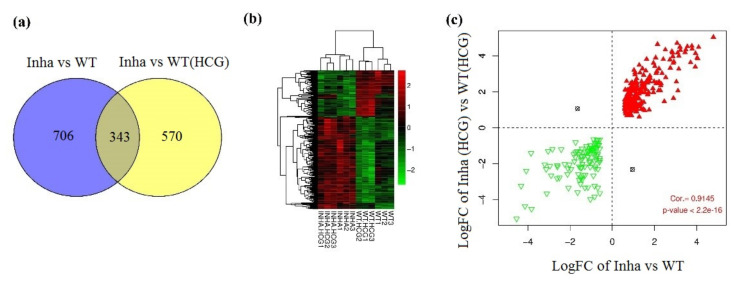
Figure 2.
(a) Venn diagram of DEGs in groups Inha−/− vs. WT and Inha−/− (hCG) vs. WT(hCG). (b) Hierarchical clustering heatmap of overlapping DEGs. (c) Scatter-plot of correlation between logFC of Inha−/− vs. WT and Inha−/− (hCG) vs. WT(hCG). The red triangle and green inverted triangle refer to up and down-regulated DEGs in both Inha−/− vs. WT and Inha−/− (hCG) vs. WT(hCG).

