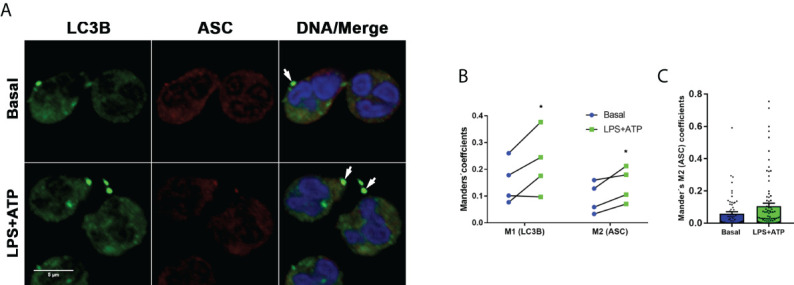
Figure 3.

Inflammasomes are targeted to autophagosomes. (A) Representative CLSM images of neutrophils stimulated or not with LPS and 2 hours later treated or not with ATP. At 4 h post-LPS stimulation, cells were fixed, permeabilized and stained with specific antibodies anti-LC3B (green) and ASC (red). Images are representative of experiments with 4 different donors. (B) Manders´ coefficients (M1; the amount of vesicular LC3B that colocalizes with ASC) and M2 (the amount of ASC that colocalizes with LC3B) calculated by image quantification of experiments performed with 4 donors as in (A) in which at least 60 cells were analyzed for each condition by using a specific macro with Fiji software. Each data in the graph corresponds to the mean of Manders´ coefficients of at least 60 cells of each individual donor per experimental condition. *p<0.05. Kruskal-Wallis test. (C) Data from a representative experiment of those included in the graph depicted in B, from which the mean value of the Mander’s M2 coefficient for LC3B was calculated.
