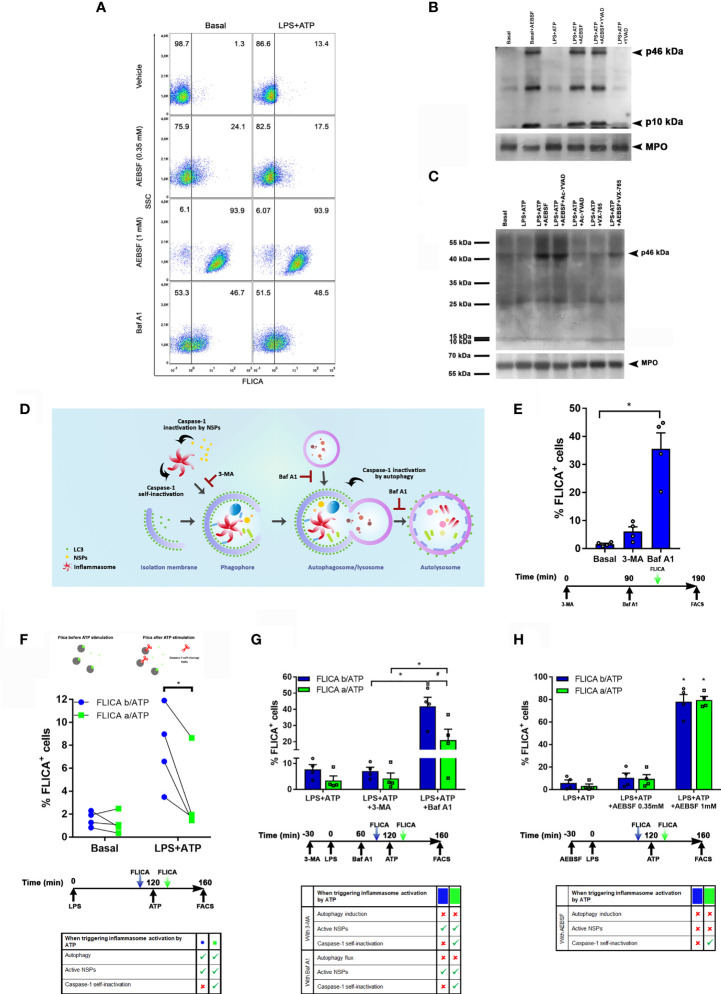
Figure 4.
Caspase-1 activity is regulated by autophagy, self-inactivation and by NSPs. (A) Neutrophils were pre-treated or not with AEBSF (t= -30 min), then stimulated or not with LPS (t= 0); and treated or not with Baf A1 (t= 1 h). At 1 h 50 min the FLICA probe was added and inflammasome activation was stimulated by ATP at 2 h and cells were assessed at 2 h 40 min by flow cytometry. Dot plots are representative of experiments with 4 donors. (B and C) Immunoblot analysis of caspase-1 in lysates of human neutrophils pre-treated or not with AEBSF (0.35 mM), Ac-YVAD-CMK (50 μM), VX-765 (50 µM) or AEBSF and the corresponding caspase-1 inhibitor together, at t= -30 min, then stimulated or not with LPS (t=0) and ATP (t= 2 h) and assessed at 3 h 30 min post-LPS stimulation. MPO levels are shown as loading control. Immunoblots are representative of 3 (B) and 2 (C) independent experiments. (D) Rationale model to explain how the different inhibitors would impact on caspase-1 activity and its detection. (E) Neutrophils were treated or not with 3-MA or Baf A1 as indicated in the schedule below the graph, stained with the FLICA probe and cell fluorescence was determined by flow cytometry. (F–H) Neutrophils were treated as indicated in the schedule below each graph. Where indicated the FLICA probe was added 10 min before (b/ATP; blue symbols/bars) or 10 min after (a/ATP; green symbols/bars) inflammasome activation by ATP, and fluorescence was determined by flow cytometry. (F; top part) depicts the rationale of the assay; grey: caspase-1, green: FLICA probe, red scissors: proteolytic cleavage. *p<0.05 (D) One way ANOVA followed by Sidak’s multiple comparisons test; (E) Paired t test; (F–G) Two-way ANOVA followed by Tukey’s multiple comparisons test. #p<0.05 (F) Two-way ANOVA followed by Sidak’s multiple comparisons test.

