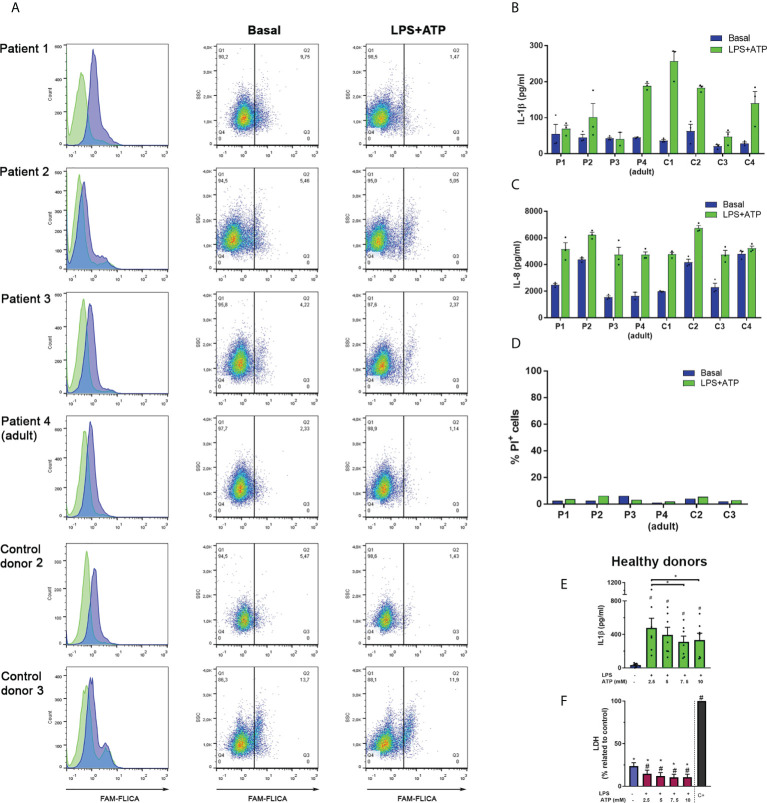
Figure 5.
Responses of neutrophils isolated from patients who are carriers of the GOF NLRP3 c.1322C>T (p.A441V) mutation. (A) Neutrophils from patients and aged-matched control donors were stimulated or not with LPS (t= 0) and 2 h later were stimulated or not with ATP. Ten min later, the FLICA probe was added, and cell fluorescence was determined at 2 h 40 min by flow cytometry. Data are depicted as histograms (blue, basal -unstimulated- condition; green, LPS+ATP-stimulated cells) to appreciate FLICA signal reduction upon stimulation; and dot plots, to show the % of cells with FLICA signal higher than the same arbitrary threshold set for all donors. (B–D) Neutrophils from patients and aged-matched control donors were stimulated or not with LPS (t= 0) and 2 h later were stimulated or not with ATP. At 5 h post-LPS stimulation IL-1β (B) or IL-8 (C) concentrations in culture supernatants were determined by ELISA and PI incorporation in the cell pellets was evaluated by flow cytometry (D). In (B) and (C), each bar represents the mean+SEM of the cytokine concentrations of an individual donor evaluated in triplicate. (E, F) Neutrophils from healthy donors were treated or not with LPS, and 2 h later with the indicated ATP concentrations. At 5 h post-LPS stimulation IL-1β (E) or LDH activity (F) were determined. Two-way ANOVA followed by Tukey’s multiple comparisons test. # and *p < 0.05. # vs basal (E, F); * vs positive control (F).

