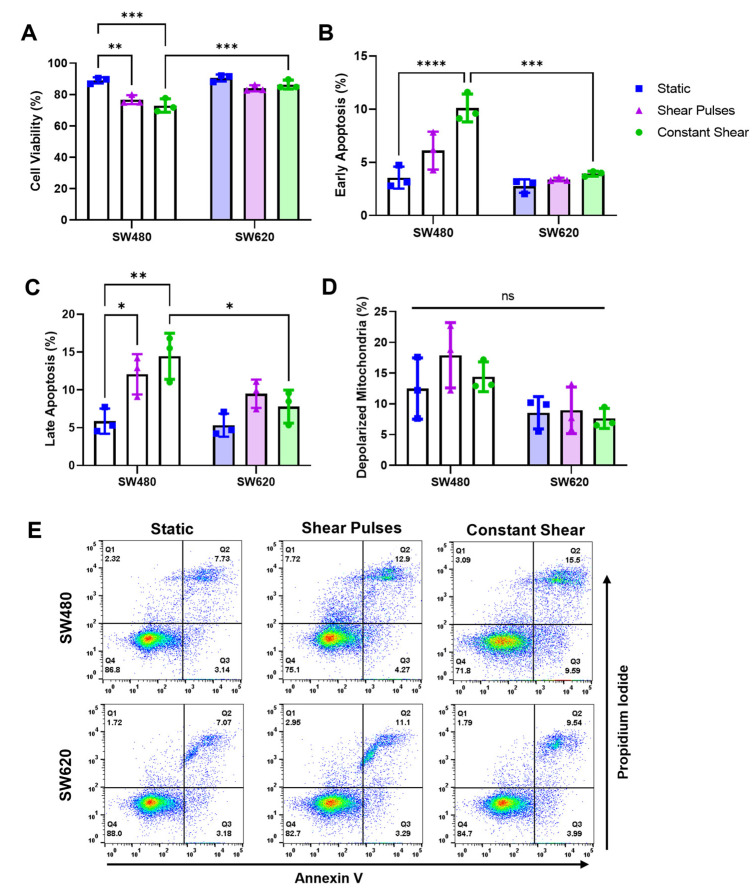
Figure 2.
SW480 cells are more sensitive to FSS compared to SW620 cells. (A–C) Cell viability and apoptosis measured via Annexin V/PI staining 24 h after FSS treatments. (D) Percentage of cells with depolarized mitochondria measured via a JC-1 assay after FSS. N = 3, ns = not significant, * p < 0.05, ** p < 0.01, *** p < 0.001, **** p < 0.0001. (two-way ANOVA with multiple comparisons). Error bars represent mean ± SD. (E) Representative flow cytometry plots showing necrotic cells (Q1), late apoptotic cells (Q2), early apoptotic cells (Q3), and viable cells (Q4).

