Figure 7.
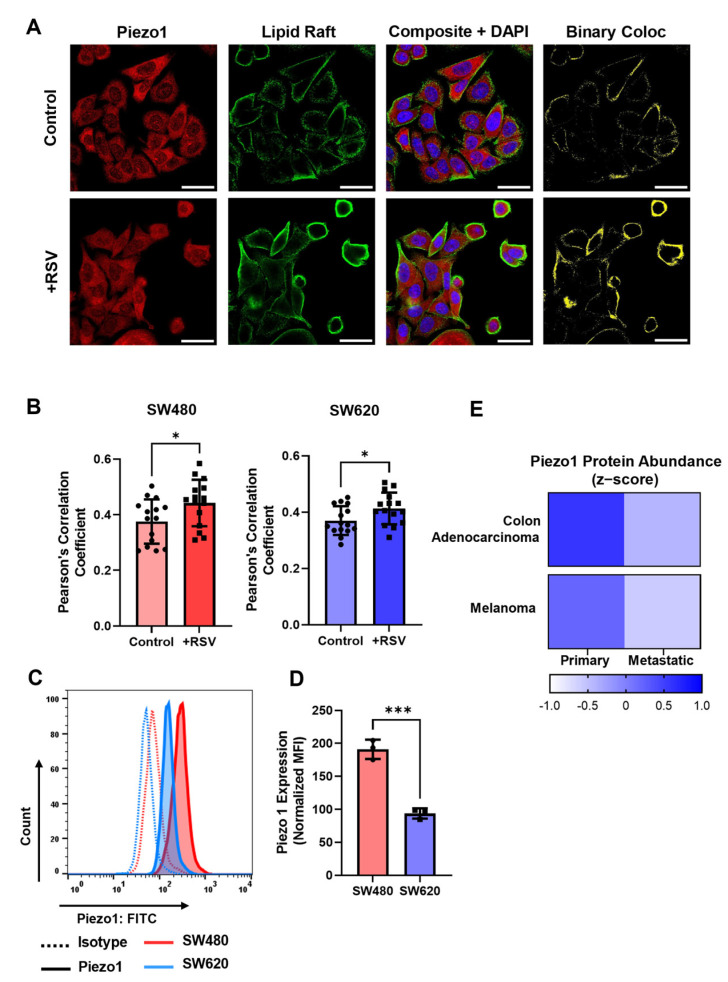
Resveratrol increases LR/Piezo1 colocalization, and SW480 cells have higher Piezo1 expression. (A) Confocal microscopy images of Piezo1 (red), lipid rafts (green), DAPI (blue), and colocalization events between Piezo1 and LR (yellow). Scale bar = 30 µm. (B) Pearson’s correlation coefficient between LR/Piezo1 was calculated using the JACoP plugin in ImageJ. N = 3 (n = 15 images), * p < 0.05 (two-tailed unpaired t-test). For all plots, error bars represent mean ± SD. (C) Expression of Piezo1 (solid line) and isotype controls (dashed lines) in SW480 (red) and SW620 (blue) cells. (D) Median fluorescence intensity of Piezo1 normalized to the respective isotype control. N = 3, *** p < 0.001 (two-tailed unpaired t-test). (E) Protein abundance data (z-scores) from the Broad Cancer Cell Line Encyclopedia, downloaded from cBioPortal. Primary tumor and lymph node metastases from the same patient with colon adenocarcinoma (SW480 and SW620) and melanoma (WM115 and WM2664). Darker blue represents a higher z-score and higher Piezo1 abundance.

