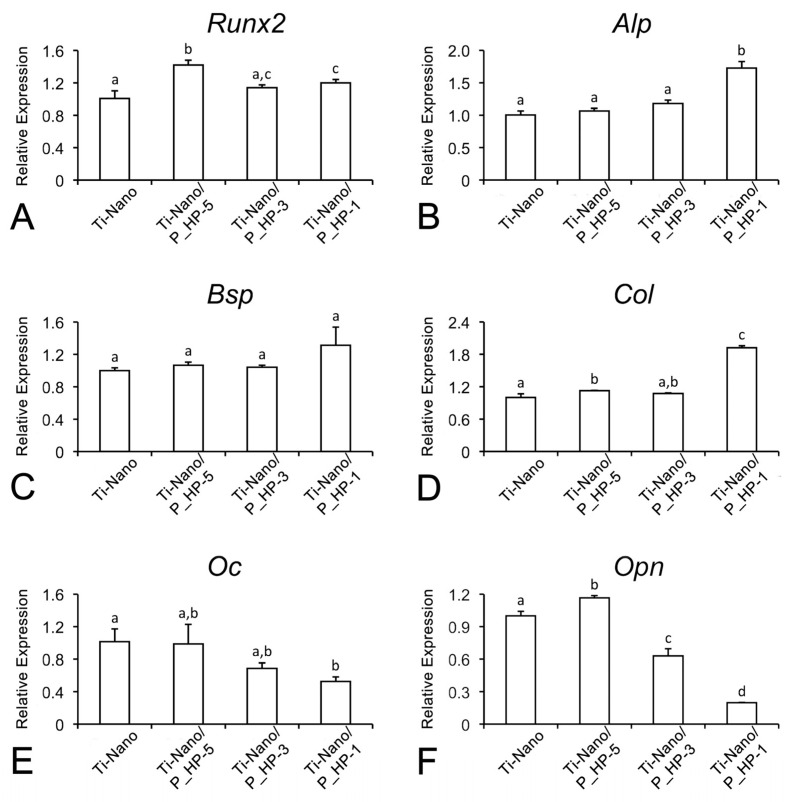
Figure 7.
Relative mRNA expression for Runx2 (A), Alp (B), Bsp (C), Col (D), Oc (E), and Opn (F) in UMR-106 cells grown on Ti-Nano surfaces functionalized with 1×10⁻⁵, 1×10⁻³, 1 mg/mL grape-pomace extract and the control surface (Ti-Nano, Ti-Nano/P_HP-5, Ti-Nano/P_HP-3, and Ti-Nano/P_HP1) on day 5 of culture. Data were normalized to Gapdh, and the value 1 was assigned to the control group. The bars that share the same letter are not significantly different from each other (p > 0.05).

