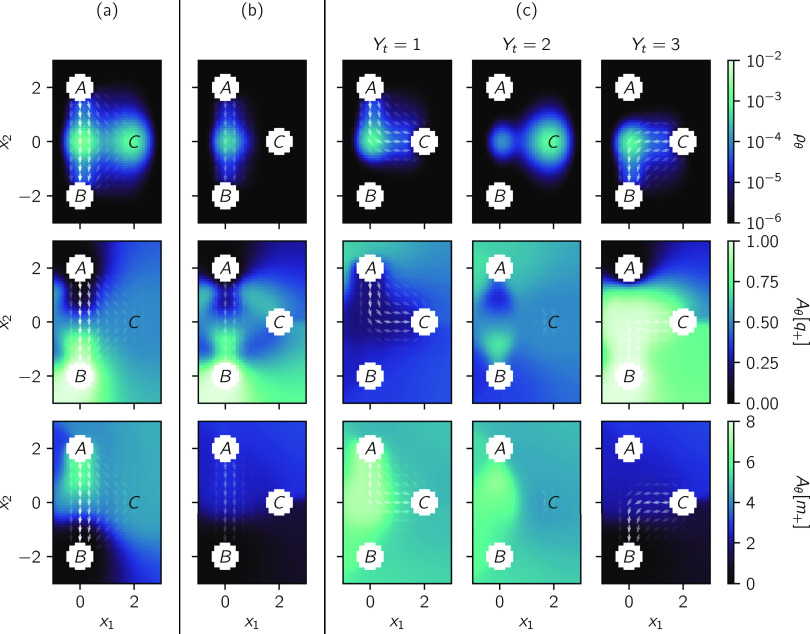
FIG. 5.
Reactive statistics for the reaction (89). The reactive current (vector field) is plotted over each of the other statistics (color scale): the forward committor Aθ[q+], the reactive density ρθ, and the conditional mean first passage time to the product Aθ[m+]. The magnitude of the reactive current is represented by the opacity of the arrows, which are comparable for the full reaction and all reaction steps. Augmented TPT statistics are computed using the augmented process (93). (a) Reactive statistics computed using traditional TPT. (b) Reactive statistics for the uncatalyzed pathway computed using augmented TPT. (c) Reactive statistics for the catalyzed pathway computed using augmented TPT.

