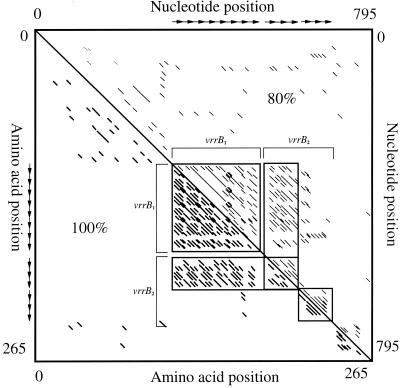
FIG. 3.
Dot plot homology analysis of the entire vrrB ORF from B. anthracis. Dot plot homology analysis was performed on both the nucleotide sequence (top right; 9-bp window; 80% similarity) and the deduced amino acid sequence (bottom left; 3-amino-acid window; 100% similarity). Sequence homology among repeat regions is indicated by corresponding diagonal lines. The boxes indicate regions where insertion-deletion events are found. The hypervariable regions vrrB1 and vrrB2 are indicated by brackets.

