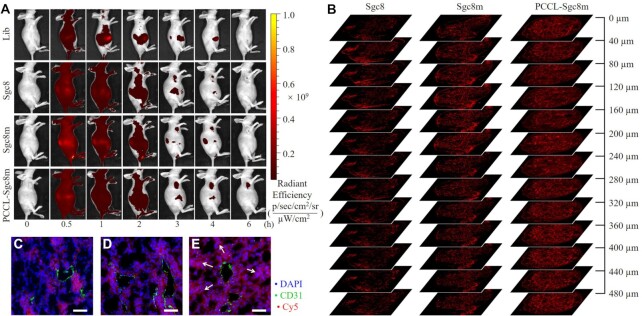
Figure 6.
(A) In vivo whole-body fluorescence imaging of HCT116 tumor-bearing mice at different time points post-injection of Cy5-labeled Lib, Sgc8, Sgc8m and PCCL-Sgc8m via tail vein. The injection dose of Cy5-labeled DNA was 4 nmol. (B) The penetration depth of various aptamers in tumor was analyzed by imaging a series of tumor tissue sections from the HCT116 tumor-bearing mice receiving intravenous injection of Cy5-labeled Sgc8, Sgc8m and PCCL-Sgc8m at tail vein. Fluorescent imaging analysis of the extravascular diffusion of Sgc8 (C), Sgc8m (D) and PCCL-Sgc8m (E) in tumor at 6-h post injection. Cy5 channel, Sgc8, Sgc8m and PCCL-Sgc8m. FITC channel, CD31. DAPI channel, nucleus. White arrows denoted extravascular Cy5 diffusion. Scale bars: 50 μm.

