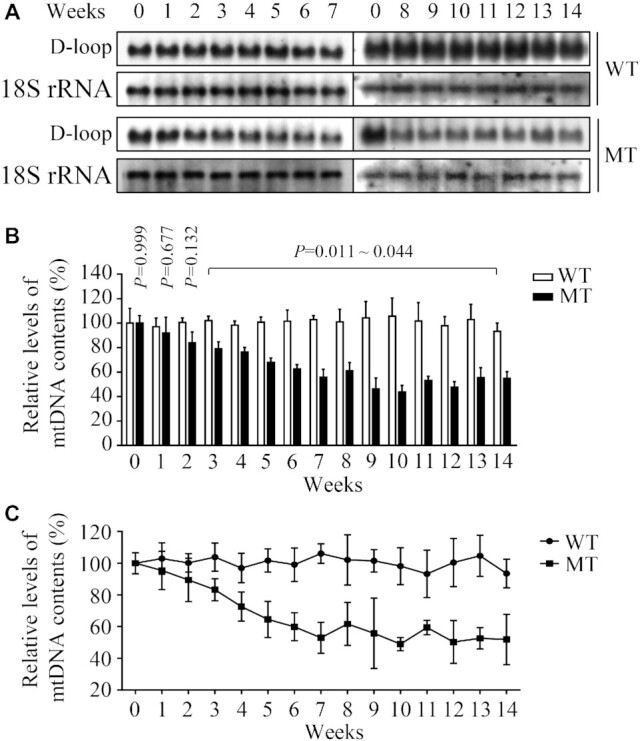
Figure 3.

Quantification of mtDNA contents. (A) Southern blot analysis of mtDNA. Equal amounts (1 μg) of genomic DNA from mutant and control cybrids after culturing from time 0 to 14 weeks were digested with BamH I, fractionated by electrophoresis through a 1.8% agarose gel, transferred onto a positively charged membrane, and hybridized with DIG-labeled probes specific for mtDNA D-Loop region and 18S rRNA as an internal control. (B) Quantification of mtDNA contents. Average relative mtDNA contents per cell were normalized to the average contents per cell of 18S rRNA in mutant and control cybrids. Relative mtDNA contents were expressed as percentages of the value for various weeks of those taken at zero time in each gel. The calculations were based on three independent experiments. (C) Measurement of mtDNA contents by qPCR. Mitochondrial DNAs from mutant and control cybrids after culturing from time 0 to 14 weeks were normalized to β-actin encoded by nuclear gene. The calculations were based on three independent experiments. Graph details and symbols are explained in the legend to Figure 2.
