
Figure 2.
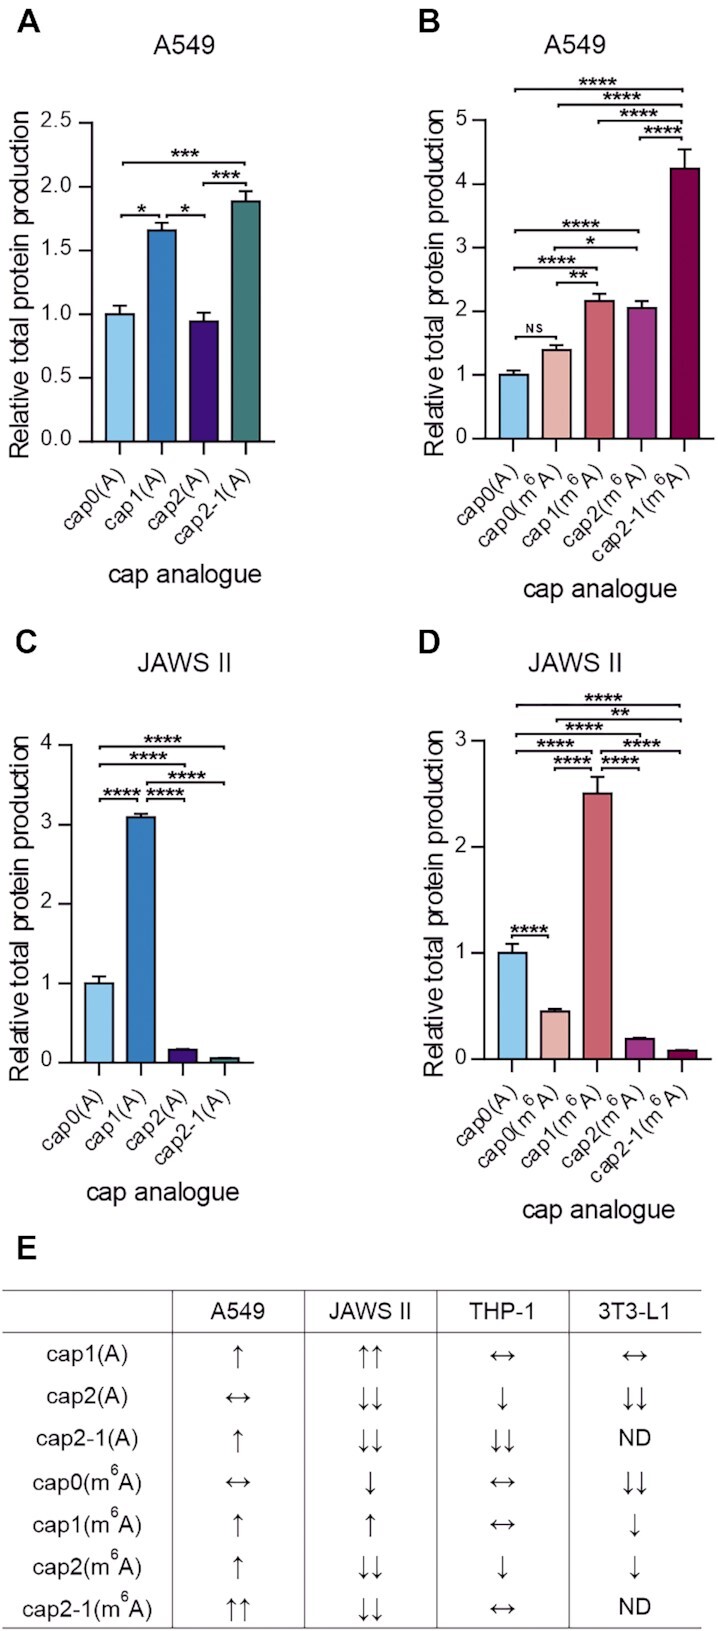
Protein production levels are affected by cap methylation status. Relative total protein production after 72 h measured in the medium from culture of (A and B) A549 and (C and D) JAWS II cells transfected with IVT mRNAs encoding Gaussia luciferase bearing various cap analogues at their 5′ ends. Bars represent the mean value ± SEM normalized to transcripts with cap0(A). Statistical significance: NS, not significant; *P <0.05; **P <0.01; ***P <0.001; ****P <0.0001 (one-way ANOVA with Turkey's multiple comparisons test). (Raw data from three independent biological replicates are shown in Supplementary Figure S2; each independent biological replicate consisted of three independent transfections.) (E) Summary table presenting the influence of the cap methylation status on protein production levels in A549, JAWS II, THP-1 and 3T3-L1 cells relative to transcript with cap0(A), ↑, increase of protein production; ↓, decrease of protein production; double arrows indicate a large (at least 3-fold) increase/decrease; ↔, no significant change.