Figure 2.
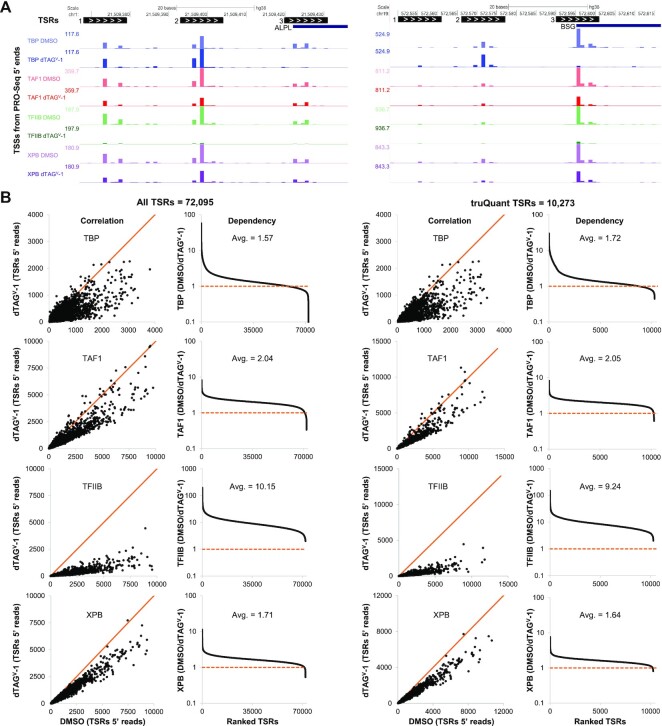
Global Pol II transcription is reduced after GTF depletion. (A) tsrPicker algorithm (see Materials and Methods) was implemented on nine combined DMSO PRO-Seq datasets to identify 11 bp TSRs (black boxes) across the genome. White arrows inside TSRs indicate the direction of transcription. TSRs identified in two genes, ALPL and BSG, each with three TSRs, are shown as examples. Also depicted are PRO-Seq 5′ ends tracks (TSSs) for each factor after DMSO or dTAGV-1 treatment. (B) Effects of GTF depletion on All TSRs (n = 72 095) or truQuant TSRs (n = 10 273). For all factors the sum of reads for the two replicas were used. Correlation plots compare the sum of the spike-in and sequence depth normalized PRO-Seq 5′ ends for each TSR in control (DMSO) and GTF-depleted (dTAGV-1) cells. Also shown are plots sorted by high to low dependency (DMSO/ dTAGV-1) of each TSR following depletion of each factor. Avg. refers to the average dependency. Solid orange lines depict a slope of 1.

