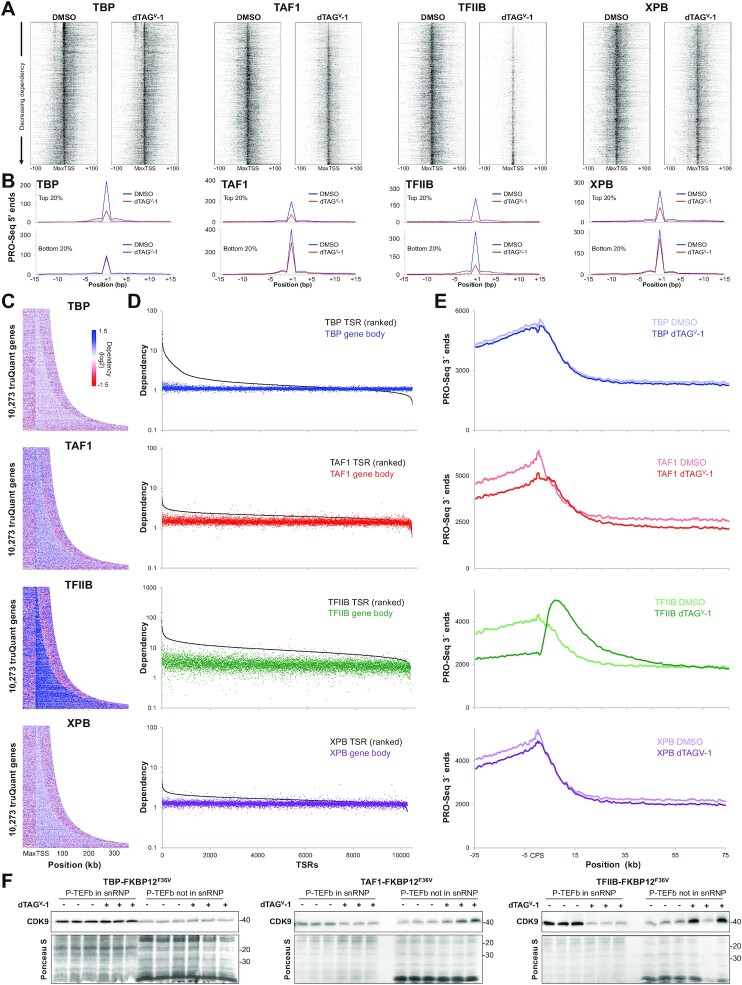
Figure 4.
Distinct effects of GTF depletion around the promoter, in the gene body and downstream of the CPS. (A) Heatmaps of PRO-Seq 5′ ends sorted by decreasing dependency centered at the MaxTSS of truQuant TSRs (n = 10 273) for each factor. (B) Plots depicting the average PRO-Seq 5′ ends at each base position in DMSO and dTAGV-1 treated cells for the top and bottom 20% dependent truQuant TSRs for each factor. (C) Dependency heatmaps of truQuant TSR gene bodies sorted by gene length and buffered with 50 kb upstream of the MaxTSS and downstream of the CPS. (D) Dependency plots of truQuant TSRs and their corresponding gene bodies. Genes are ordered left to right by their TSR dependency. (E) Average PRO-Seq 3′ ends across all truQuant genes at the indicated positions around the CPS after DMSO or dTAGV-1 treatment. (F) Western blot analysis of Cdk9 levels from cells treated with DMSO or dTAGV-1 extracted with buffer containing 150 mM KCl or 450 mM KCl to obtain free (P-TEFb in snRNP) or chromatin associated Cdk9 (P-TEFb not in snRNP), respectively. This experiment was performed in triplicate. The nitrocellulose membrane below the Cdk9 band was cut and stained with Ponceau S for a loading control.

