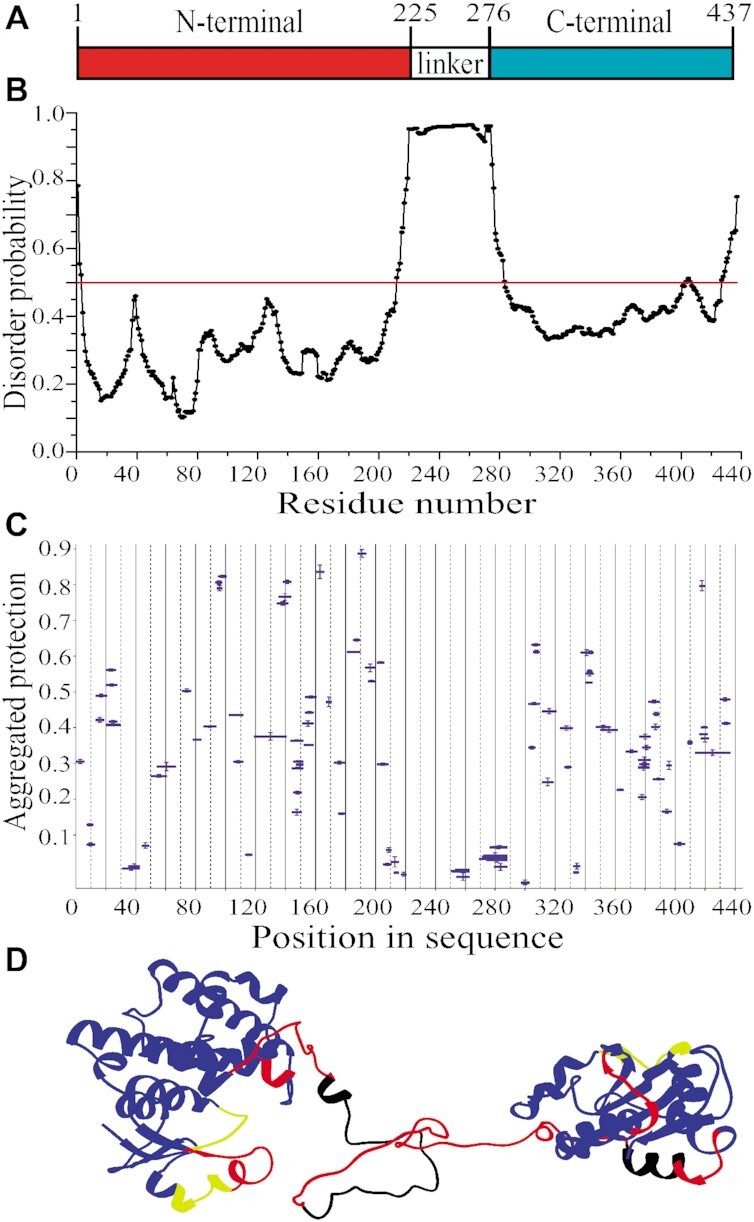
Figure 3.

Structural organization of full-length eEF1Bγ. (A) Domain organization of eEF1Bγ. (B) Prediction of the disordered region in eEF1Bγ. All residues whose disorder probability is over 0.5 (red line) are considered as disordered. (C) The aggregated protection plot of the eEF1Bγ peptides. The aggregated protection values for peptides (mean ± SD, n = 3 measurements) are plotted versus their position in the protein sequence. (D) A 3D model of eEF1Bγ colored according to the HDX-MS data. Red color indicates unprotected and unstructured regions (<0.05), yellow – weakly protected dynamic segments (0.05–0.15), blue – highly protected rigidly structured regions (>0.15), black – the regions with missing peptides.
