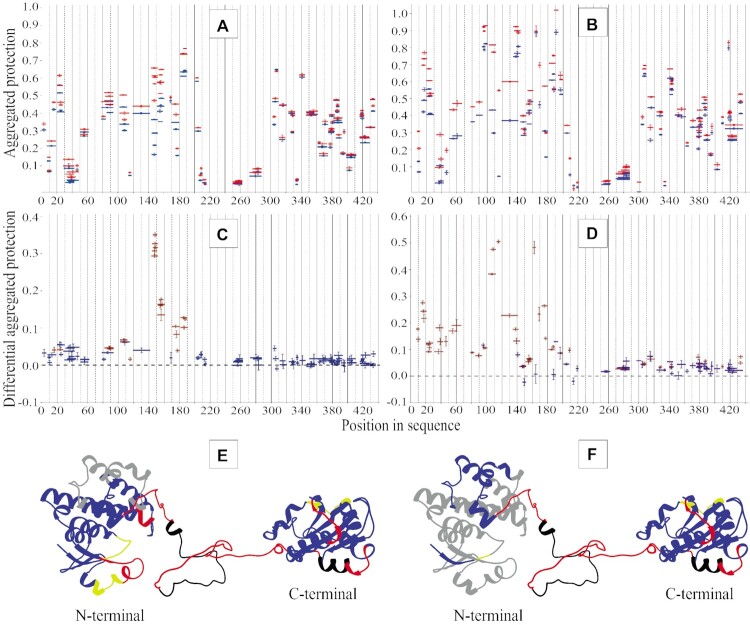
Figure 6.
Mapping the protein-protein interactive surfaces on the eEF1Bγ subunits by HDX-MS. The aggregated protection of peptides derived from eEF1Bγ (blue color) and involved into the eEF1Bαγ (A) and eEF1Bβγ (B) complexes (red color) are depicted. The differential aggregated protection plots (C) and (D) show the eEF1Bγ peptides that change their protection (brown color) in the complexes with eEF1Bα and eEF1Bβ, respectively (the difference is statistically significant for at least three or more incubation time-points). The peptides indicated in blue in the plots (C) and (D) do not change their protection. The regions of eEF1Bγ that change their aggregated protection values upon interaction with eEF1Bα (E) and eEF1Bβ (F) are painted in gray.

