Figure 2.
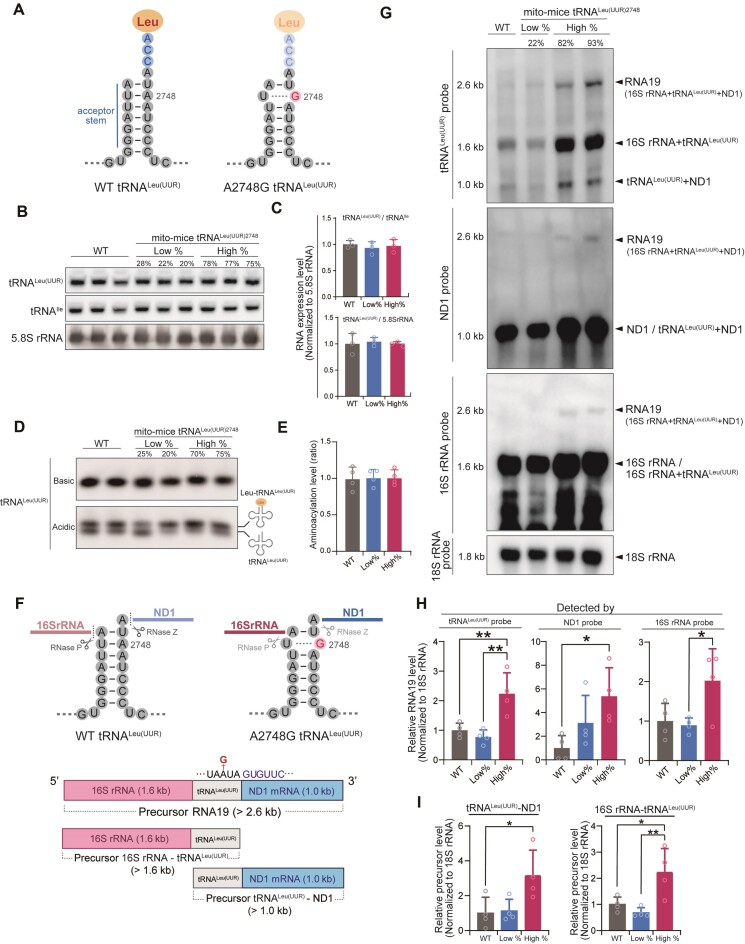
Steady-state level, aminoacylation, and processing of tRNALeu(UUR) in mito-mice tRNALeu(UUR)2748. (A) Schematic illustration of the secondary structural of tRNALeu(UUR) with and without the A2748G mutation. Note that the A2748-to-G mutation in the acceptor stem will impair Watson–Crick base-pairing. (B) Northern blotting of mature tRNA levels in total RNA isolated from livers of 10-month-old mice. mt-tRNALeu(UUR) levels were normalized to mt-tRNAIle and nuclear DNA-encoded 5.8S rRNA. Quantification of tRNALeu(UUR) levels (C) showed no statistically significant difference between the three groups. Data are presented as the mean ± SD. n = 3 for each group. (D) Representative aminoacylated (upper band) and nonaminoacylated (lower band) tRNALeu(UUR) levels in total RNA from livers of 10-month-old mice were examined by northern blotting under acidic conditions. (E) Quantification of aminoacylated tRNALeu(UUR) levels based on Supplementary Figure S3A. Levels of aminoacylated tRNALeu(UUR) were normalized by the sum of aminoacylated and nonaminoacylated tRNA. Data are presented as the mean ± SD. n = 4 for each group. (F) Schematic diagram of the primary and secondary structure of precursor pre-mRNA that contains 16S rRNA, tRNALeu(UUR), and ND1. RNase P and RNase Z are responsible for cleaving 16S rRNA-tRNALeu(UUR), and tRNALeu(UUR)-ND1, respectively. (G) Representative northern blotting of precursor transcripts in total RNA obtained from the livers of 10-month-old mice. Hybridization of three different probes designed to recognize tRNALeu(UUR), ND1 and 16S rRNA revealed expression of the 2.6 kb precursor transcript RNA19, the precursor 16S rRNA-tRNALeu(UUR) (1.6 kb), and the precursor tRNALeu(UUR)-ND1 mRNA (1.0 kb). (H) Quantification of precursor transcript RNA19 levels detected with each probe based on Supplementary Figure S3B. Precursor RNA19 levels were normalized by the 18S rRNA transcripts. Data are presented as the mean ± SD; *P < 0.05, **P < 0.01 by Tukey–Kramer test. n = 4 for each group. (I) Quantification of precursor transcript levels of tRNALeu(UUR)-ND1 (blue arrowheads in Supplementary Figure S3B) and 16S rRNA-tRNALeu(UUR) (red arrowheads in Supplementary Figure S3B) detected with tRNALeu(UUR) probe based on the low exposure time membrane in Supplementary Figure S3B. Each precursor transcript levels were normalized by the 18S rRNA transcripts. *P < 0.05, **P < 0.01 by Tukey–Kramer test. Data are presented as the mean ± SD. n = 4 for each group.

