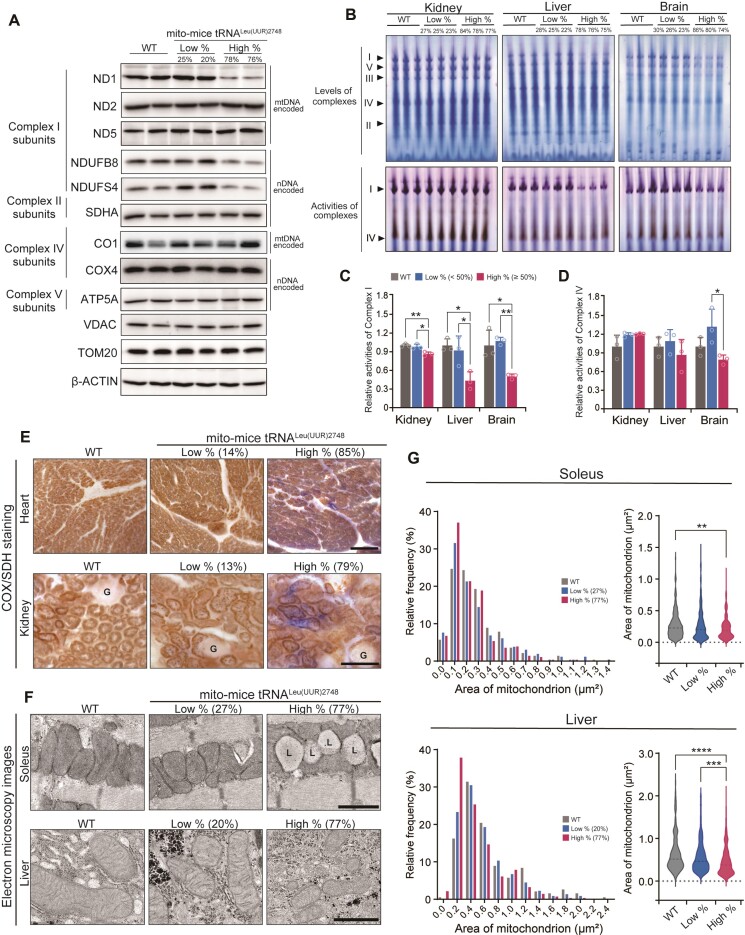
Figure 3.
Mitochondrial complex activities and morphology in mito-mice tRNALeu(UUR)2748. (A) Representative images of the levels of indicated subunits of Complexes I, II, IV, and V in livers of 10-month-old mice examined by western blotting. ND1, ND2, ND5 and CO1 are mtDNA-derived proteins, while others are nuclear DNA (nDNA)-derived. TOM20, VDAC and β-ACTIN were used as loading controls. (B) Native–PAGE gel images show the amount of each mitochondrial respiratory complexes (top) and the activity of Complexes I and IV (bottom) in kidney, liver, and brain tissues of 10-month-old mice in the gel. Quantification of Complex I activity (C) and Complex IV activity (D) in the kidney, liver, and brain (Each group, n = 3). Data are presented as the mean ± SD; *P < 0.05, **P < 0.01 by Tukey–Kramer test. (E) Histochemical analysis of Complexes II and IV activities in heart and kidney from 10-month-old mice. Complex IV-positive (COX+) cells are stained in brown, and Complex IV-negative/Complex II-positive (COX-SDH+) cells are stained in blue. Note that kidney and heart of high % group mice contain COX-SDH + cells. Glomeruli (‘G’) of renal cells were not sufficiently stained owing to a scarcity of mitochondria. Scale bar = 100 μm. (F) Electron microscopy images of mitochondria in soleus muscle and liver from 10-month-old mice. The ‘L’ indicates lipid droplets. Scale bars = 1 μm. (G) The mitochondrial areas in soleus muscle and liver were analyzed by histogram and violin plot (each group has at least 200 mitochondria). **P < 0.01, ***P < 0.001, ****P < 0.0001 by Kruskal–Wallis test.

