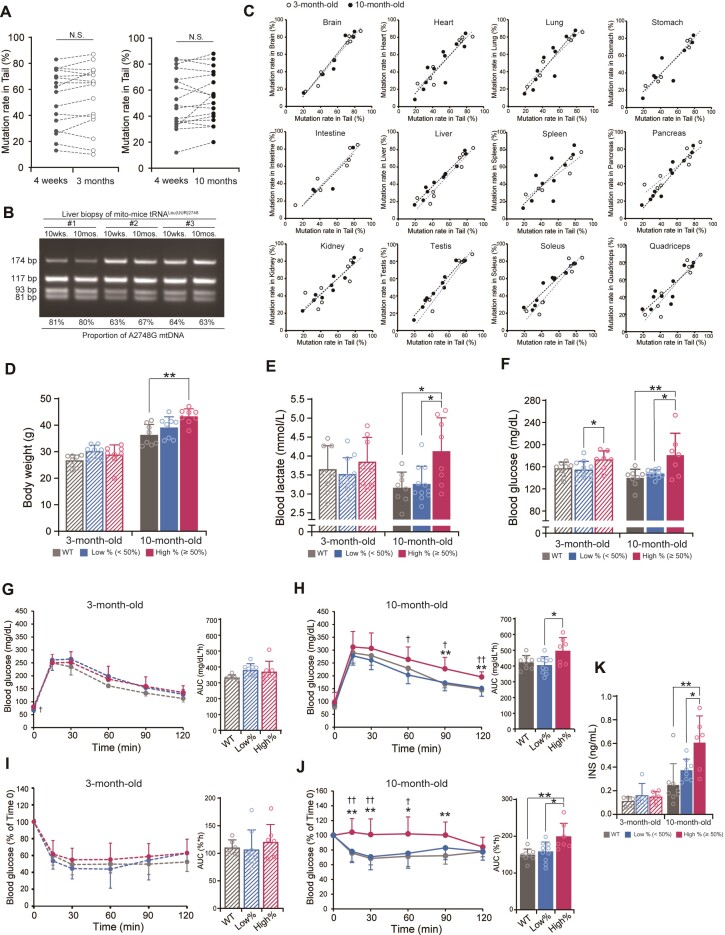
Figure 4.
Metabolic phenotypes of mito-mice tRNALeu(UUR)2748. (A) The proportion of A2748G mtDNA in the tail of the same mutant mouse did not change over time (n = 16 each for comparison of 4-week-old and 3-month-old; n = 17 each for comparison of 4-week-old and 10-month-old mice). (B) For individual mutant mice, liver biopsy was taken at 10-week-old and 10-month-old, followed by PCR to examine the mutation rate. No age-dependent variation was observed in the liver biopsies. (C) The mutation rate of A2748G mtDNA in tail was correlated with that in the indicated tissues from both 3-month-old (open circle) and 10-month-old (black circle) mice. The black dotted line and the blue dotted line represent linear regressions for the data of 10-month-old and 3-month-old mice, respectively. (D) Body weight of mito-mice tRNALeu(UUR)2748 and wild-type mice at 3 and 10 months of age (n = 8 for each group). **P < 0.01 by Tukey–Kramer test. (E) Blood lactate levels in mito-mice tRNALeu(UUR)2748 and wild-type mice at 3 and 10 months of age (WT, n = 8; low %, n = 11; high %, n = 8). *P < 0.05 by Tukey–Kramer test. (F) Blood glucose levels in mito-mice tRNALeu(UUR)2748 and wild-type mice at 3 and 10 months of age (WT, n = 8; low %, n = 11; high %, n = 7). *P < 0.05, **P < 0.01 by Tukey–Kramer test. (G, H) Oral glucose tolerance test and area under the curve (AUC) of 3-month-old mice (G) (WT, n = 8; low %, n = 8; high %, n = 7) or 10-month-old mice (H) (WT, n = 6; low %, n = 10; high %, n = 7). *High % group versus wild-type; †high % versus low % groups. *P < 0.05, **P < 0.01 by Tukey–Kramer test. (I, J) Insulin tolerance test and area under the curve (AUC) of 3-month-old mice (I) (WT, n = 8; low %, n = 8; high %, n = 7) or 10-month-old mice (J) (WT, n = 6; low %, n = 10; high %, n = 7). *High % group versus wild-type; †high % versus low % groups. *P < 0.05, **P < 0.01 by Tukey–Kramer test. (K) Plasma insulin levels in mito-mice tRNALeu(UUR)2748 and wild-type mice at 3 and 10 months at steady state (3-month-old: WT, n = 5; low %, n = 5; high %, n = 6; 10-month-old: WT, n = 8; low %, n = 8; high %, n = 6). *P < 0.05, **P < 0.01 by Tukey–Kramer test. All data are presented as the mean ± SD.

