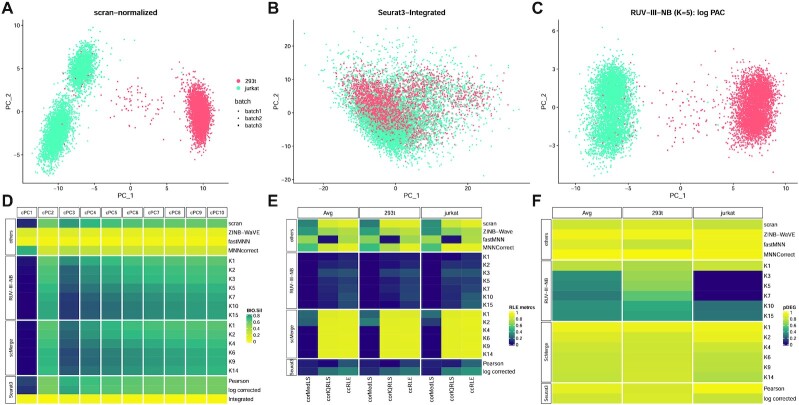
Figure 3.
Cell line study. (A) The first two PCs of scran-normalized data. Colour refers to cell type. Batch effects are visible for the Jurkat cells. (B) PCs of Seurat3-Integrated data removes cell type separation. (C) PCs of RUV-III-NB log percentile adjusted counts (PAC). Clustering by cell type is clearly visible with batch effects removed. (D) Median biological silhouette score for different numbers of cumulative PCs. RUV-III-NB and scMerge improve the biological signal relative to scran and increasing the number of unwanted factors beyond a certain point only slightly degrades performance. (E) Squared correlation between median (corMedLS) and IQR (corIQRLS) of relative log expression (RLE) with log library size and squared of total canonical correlation (ccRLE) between median and IQR of RLE and log library size and batch variables. (F) Proportion of DEG when comparing cells of the same type across batches.

