Figure 2.
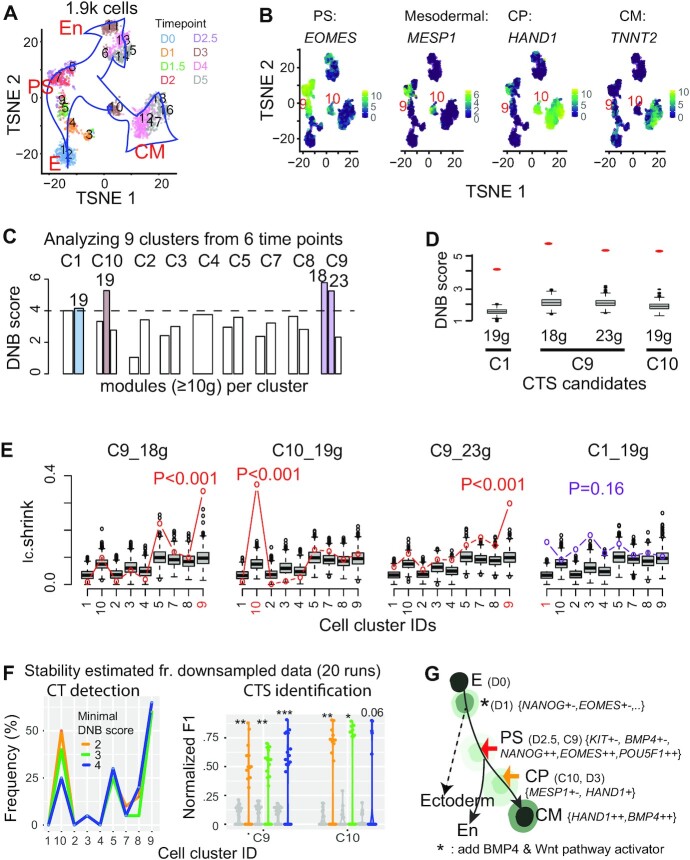
Applying BioTIP to the hESC dataset identified significant CTSs characterizing the verified bifurcations, being independent of the trajectory topologies. (A) TSNE plot for all cells colored by eight collection days (D) and labeled by 18 predefined clusters. Blue arrows indicate the developmental trajectory. E: epiblast, PS: primitive streak; CM: cardiomyocyte, En: endoderm. (B) TSNE plot for the 1.9k cells, colored by the expression levels of four genes marking PS, mesoderm, cardiomyocyte progenitor (CP), and CM. Clusters of PS and CP cells are labeled. See Supplementary Figure S2a for details. (C) Bar plots showing DNB scores in nine clusters (C) of 929 cells along the CM trajectory with cells collected before day 4. The horizontal dashed line indicates a cutoff, resulting in four gene modules with the module sizes listed atop (colored bars). See Supplementary Figure S2b for details. (D) Comparing the observed (red dot) versus simulated (box) DNB scores of the 4 resulting CTS candidates that were significant in the DNB-scoring system (P <0.001). Gene numbers are given at bottom. (E) Technical evaluation of the four CTS candidates, labeled by the cell-cluster identity from which the CTS was identified (highlighted red in axis). Observed Ic.shrink (colored line) is compared to the gene-size-controlled random scores (boxes, 1000 runs). Also shown is the P-value of Delta of the observed Ic.shrink at the CTS-indicated CT state, resulting in three significant CTSs (red p-values). See Supplementary Table S1 for parameters. (F) Stability of BioTIP estimated from 929 cells of predefined clusters and 96 genes after down-sampling 95% genes and 95% cells (20 runs). Left: frequency of identifying each cluster as a significant CT state. Right: Normalized F1 score compares each run and the identified CTSs from the whole dataset, at two CT clusters. For C9, the union of two identified CTSs (see panel e) served as the proxy gold standard. The grey violin plots present negative control scores. Color represents the minimal DNB score to prioritize gene modules. *P< 0.05, **P< 0.01, ***P< 0.001 in t-test. (G) Tipping points (TPs) along the trajectory from early stem cell to CM differentiation (adapted from (11) and (29)). Each cell state (stable or transitional) has specific markers. The states are colored by energy values estimated by MuTrans. Lighter colors represent higher energy (Detailed in Supplementary Figure S5a). Colored arrows distinguish the verified tipping point (red) or the BioTIP-identified one (orange); both are verified by QuanTC and MuTrans. See Supplementary Figure S5 for MuTrans results, Supplementary Figure S4 for QuanTC results.

