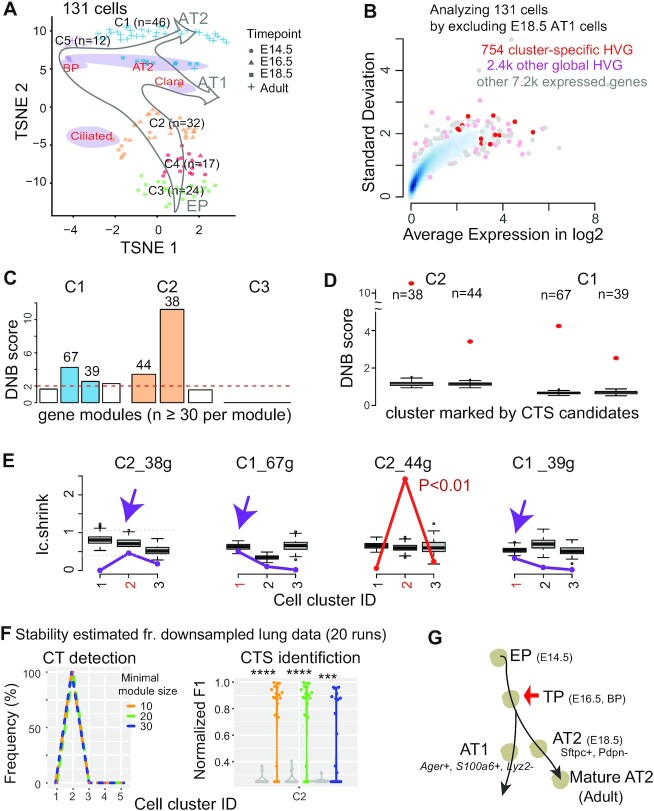
Figure 3.
Applying BioTIP to lung epithelial developmental data identified a CTS for the known critical transition, which shows a significant but not the highest DNB score. (A) TSNE plot of 131 lung epithelium cells shaped by collection days. It is colored and numbered by five clusters detected from the transcriptomes. Purple ovals highlight four subpopulations of E18.5 cells with published cell identities. Grey hollow arrows illustrate the knowledge-based pseudo-orders. EP: early progenitor; BP: biopotential progenitor. (B) Smooth color density scatter plot of 10.3k expressed genes. The blue dots represent a high density while the grey dots represent a low density. Highlighted in pink or red are the global HVG selected to conduct simulation statistics and the cluster-specific HVG (red) from which CTS candidates are identified. (C–G) Similar to Figure 2C–G, showing results for three clusters having 20 or more cells. Panel E has purple arrows pointing to when the observed score falls into the range of random scores at the intended cluster, and the CTS candidate is rejected. Panel f uses a proxy gold standard of 16 genes characterizing E16.5 cells by at least three out of five predictions (detailed in Supplementary Figure S1b). ****P< 0.0001 in t-test. Panel G points to the known tipping point at E16.5 which is verified by QuanTC (See also Supplementary Figure S6).

