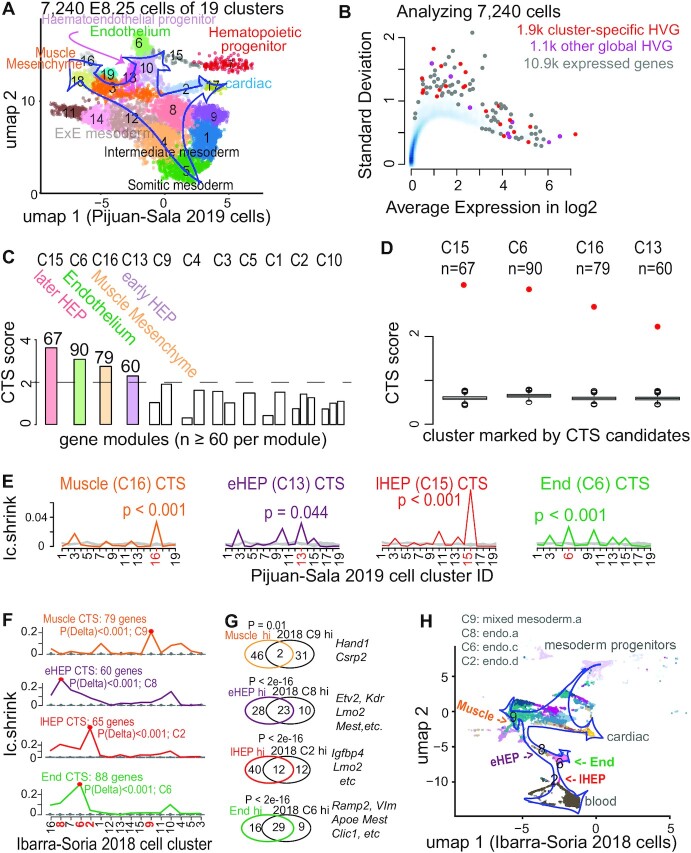
Figure 4.
Applying BioTIP to data of developing mesoderm identified four significant and reproducible CTSs. (A) Uniform manifold approximation and projection (umap) plot of 15.9k developing mesoderm cells (E8.25, GSE87038, published in 2019) colored and numbered by 19 clusters of transcriptionally similar cells (See Supplementary Figure S7a, b). Blue hollow arrows illustrate the knowledge-based pseudo-orders. ExE: extra-embryonic. (B) Similar to Figure 3b, showing the smooth scatter plot of 10.9k expressed genes. (C–E), Similar to Figure 2C–E. Each illustrates the results in 11 of 19 clusters that have module identifications. See Supplementary Figure S7d for stability. (F) Validating the four CTSs in independent profiles of 11 039 E8.25 cells of 16 pre-defined sub-cell types (published in 2018). Ic.shrinks of each CTS across these sub-cell types (line) were compared to their empirically simulated scores (box, 1000 runs). Calculation was conducted after mapping all CTS genes (n = 79, 60, 67, 90) to this profiling, extracting >98% of CTS genes (n = 79, 60, 65, 88, respectively) measured. The sub-cell type with the highest Ic.shrink is highlighted with a red dot, and the p-value for the Delta is shown. The red number on the x-axis indicates ‘CTS-mapped’ states of bifurcation. (G) Venn-diagram comparing the up-regulated biomarkers of each bifurcation state (in 2019 profiles) with the biomarkers of the mapped sub-cell types (in independent 2018 profiles). The numbers in the Venn count the up-regulated biomarkers (See Supplementary Figure S8). Circle color represents the four CTSs. Fisher's Exact tested P value. Some shared markers are displayed to the right. (H) Umap showing 2018 E8.25 cells, colored and indexed by 16 unique sub-cell types. Blue hollow arrows illustrate the knowledge-based pseudo-orders. Colored text indicates four CTS-mapped states of bifurcation.

