Figure 3.
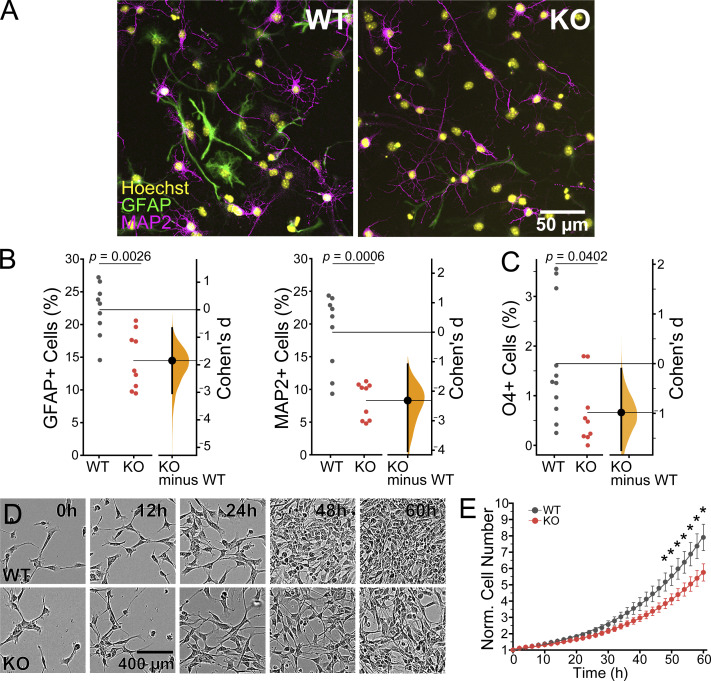
Piezo1 KO reduces differentiation and proliferation in vitro. (A) Representative fluorescence images of cultured E10.5 WT and Piezo1 KO NSCs differentiated for 4 d in vitro and immunostained for astrocytic marker GFAP (green), neuronal marker MAP2 (magenta), and counterstained nuclei with Hoechst (yellow). (B) Gardner-Altman estimation plot of the percentage of GFAP+ (Cohen’s d = −1.85) and MAP2+ (Cohen’s d = −2.32) differentiated cells. n = 9 samples from 4 embryos for each of WT and for Piezo1 KO from three independent experiments. 7,461 cells from 14 unique fields of view quantified for WT and 5,957 cells from 18 unique fields of view quantified for Piezo1 KO. (C) Gardner-Altman estimation plots of the percentage of cells immunostained for the oligodendrocyte marker O4+ after 10 d of differentiation. See also Fig. S3. Data are from n = 11 samples from 6 embryos, 4,489 cells from 51 unique fields of view quantified for WT and n = 9 samples from 4 embryos, 3,941 cells from 54 unique fields of view quantified for Piezo1 KO from two independent experiments (Cohen’s d = −0.984). (D) Representative live-cell phase-contrast images from proliferating WT and Piezo1 KO NSCs imaged over 60 h. See also Video 2. (E) Quantitation of proliferation from live-cell imaging of NSC proliferation as shown in Video 2. Data are from four images per three wells for each of n = 4 embryos for WT and n = 4 embryos for Piezo1 KO, P < 0.05 for all points after 48 h (from left to right: P value = 0.04847 at 48 h, 0.047 at 50 h, 0.04246 at 52 h, 0.04451 at 54 h, 0.04067 at 56 h, 0.03997 at 58 h, 0.03733 at 60 h as determined by two-sample t-test).

