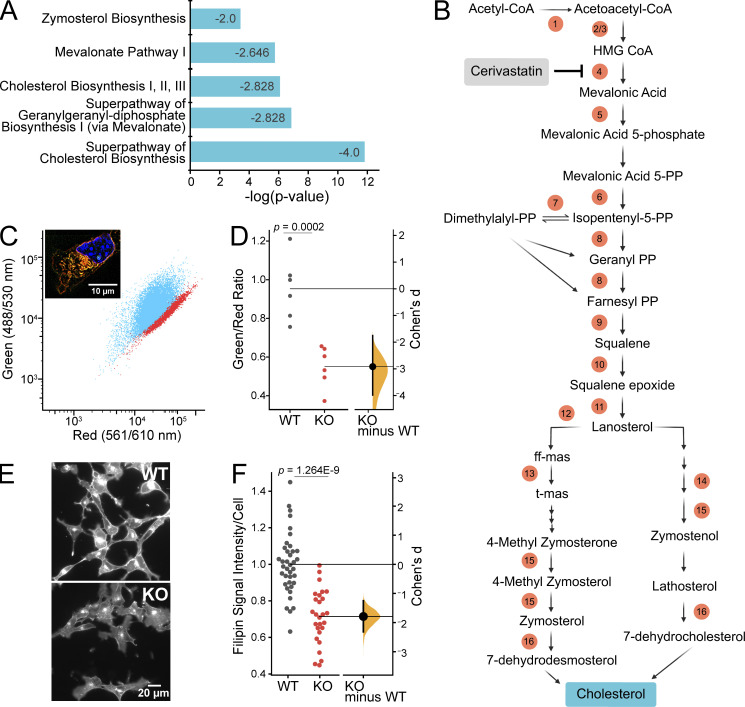
Figure 4.
Piezo1 KO results in downregulation of cholesterol biosynthesis. (A) Downregulation of cholesterol biosynthesis, the most predominant effect of Piezo1 KO identified by Ingenuity Pathway Analysis of differential gene expression data of WT and Piezo1 KO E10.5 brains. See also Table S2. Z-score is indicated inside the bar for each pathway. (B) Schematic of the cholesterol biosynthesis pathway. Circled numbers indicate the 16 enzyme genes within the pathway downregulated by 1.5-fold or more in Piezo1 KO brains relative to WT. ff-mas, 14-demethyl-14-dehydrolanosterol; t-mas, 14-demethyl-lanosterol. Numbers correspond to the following list: (enzyme, gene name, Log2Ratio) 1, acetyl-CoA acetyltransferase 2, Acat2, −1.00; 2, HMG-CoA synthase 1, Hmgcs1, −1.24; 3, HMG-CoA synthase 2, Hmgcs2, −1.67; 4, HMG-CoA reductase, Hmgcr, −0.74; 5, Mevalonate kinase, Mvk, −0.72; 6, Mevalonate-5-pyrophosphate decarboxylase, Mvd, −0.95; 7, Isopentenyl-5-isomerase, Idi1, −1.45; 8, Farnesyl diphosphate synthase, Fdps, −1.64; 9, Squalene synthase, Fdft1, −0.98; 10, Squalene epoxidase, Sqle, −0.61; 11, Lanosterol synthase, Lss, −0.82; 12, Cytochrome P450 subfamily member A1, Cyp51 −0.84; 13, Transmembrane 7 superfamily, Tm7sf2, −0.98; 14, Methosterol monooxygenase, Msmo, −1.25; 15, Hydroxysteroid 17 beta-dehydrogenase, Hsd17b7, −0.81; 16, Sterol C-5 desaturase, Sc5d, −0.78. Cerivastatin (gray box) is an inhibitor of HMG-CoA reductase, the rate-limiting enzyme of the cholesterol biosynthesis pathway. (C) Representative scatter plot of flow cytometry analysis of Nile Red stained WT and Piezo1 KO NSCs. WT (blue), Piezo1 KO (red). Inset: Representative overlay image of both green and red channels of Nile Red stained images of WT NSCs grown in proliferative conditions. Nuclei are counterstained with Hoechst (blue). (D) Gardner-Altman estimation plot of data as in C of Nile Red staining of NSCs plotting the ratio of the geometric mean fluorescence obtained from the green and red channels of WT and Piezo1 KO NSCs (Cohen’s d = −2.92). Data are from n = 6 samples from 3 embryos for WT and for Piezo1 KO and are representative of two experimental replicates. (E) Representative images of WT and Piezo1 KO NSCs grown in proliferative conditions and stained with Filipin III (see also Fig. S6). (F) Gardner-Altman estimation plot of data as in E of Filipin III staining of NSCs plotting the fluorescence intensity per cell in images of WT and Piezo1 KO NSCs (Cohen’s d = −1.79). Data from n = 4 embryos, 899 cells from 38 unique fields of view for WT and n = 4 embryos, 729 cells from 27 unique fields of view quantified for Piezo1 KO from three experimental replicates.

