Figure 5.
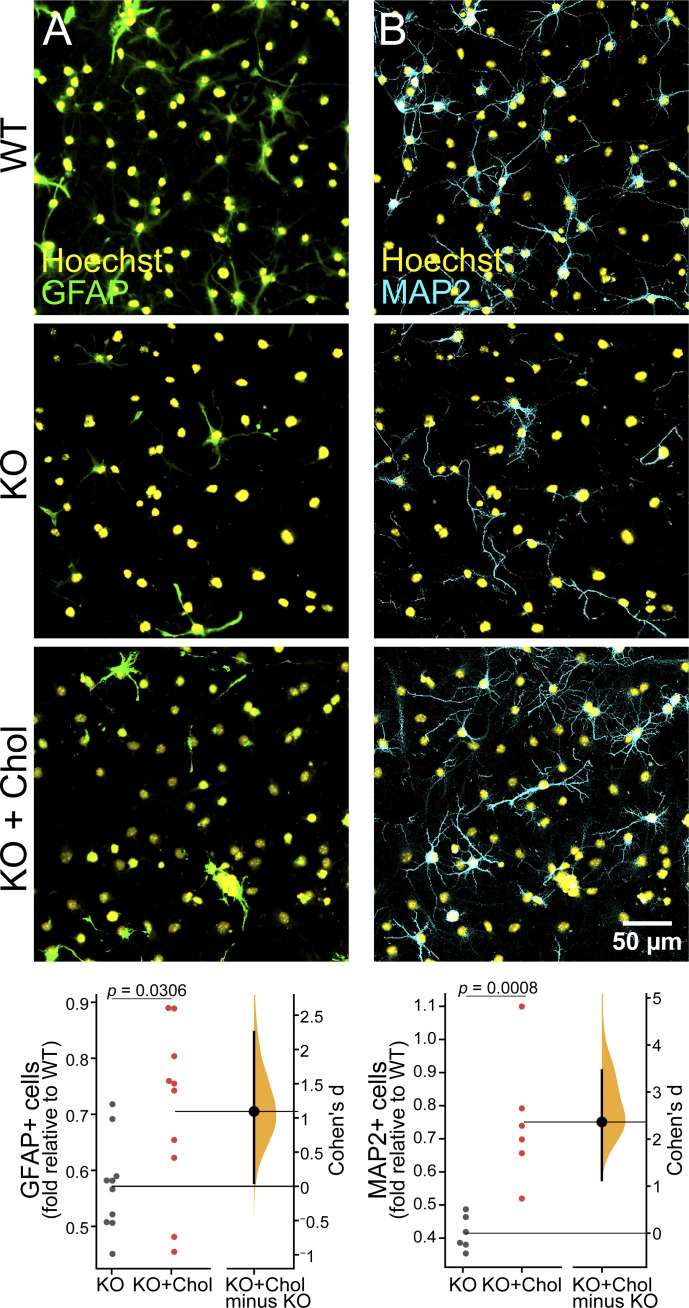
Piezo1 KO NSC differentiation is partially rescued by exogenous cholesterol. (A) Representative fluorescence images of WT and Piezo1 KO NSCs differentiated for 4 d and immunostained for GFAP (green) and nuclei stained with Hoechst (yellow). Cells were either maintained in standard differentiation media (top panels) or media supplemented with 10 µg/ml cholesterol-MBCD (bottom panel). Bottom row shows a Gardner-Altman estimation plot of images as in A shows increased astrocyte differentiation with cholesterol-MBCD supplementation of Piezo1 KO NSCs. Data are normalized to untreated WT samples. n = 7 embryos, 9,797 cells from 24 unique fields of view quantified for WT, and n = 7 embryos, 12,020 cells from 39 unique fields of view quantified for Piezo1 KO and 11,761 cells from 37 unique fields of view quantified for Piezo1 KO + cholesterol from four independent experiments (Cohen’s d = 1.09). (B) Representative fluorescence images of WT and Piezo1 KO NSCs differentiated for 4 d and immunostained for MAP2 (cyan) and nuclei-stained with Hoechst (yellow). Cells were either maintained in standard differentiation media (top panels) or media supplemented with 10 µg/ml cholesterol-MBCD (bottom panel). Gardner-Altman estimation plot of images as in B shows increased neuronal differentiation with cholesterol supplementation of Piezo1 KO NSCs. Data are normalized to untreated WT samples. For GFAP, n = 14 samples from 7 embryos, 9,797 cells from 24 fields of view; for WT, n = 10 samples from 7 embryos, 12,020 cells from 39 fields of view; for Piezo1 KO, n = 10 from 7 embryos, 11,761 cells from 37 fields of view for Piezo1 KO + cholesterol from four independent experiments (Cohen’s d = 1.09). For Map2, n = 6 samples from 4 embryos, 7,461 cells from 14 unique fields of view quantified for WT and n = 6 samples from 4 embryos, 5,987 cells from 18 unique fields of view quantified for Piezo1 KO and 5,414 cells from 16 unique fields of view for Piezo1 KO + cholesterol from two independent experiments (Cohen’s d = 2.36).

