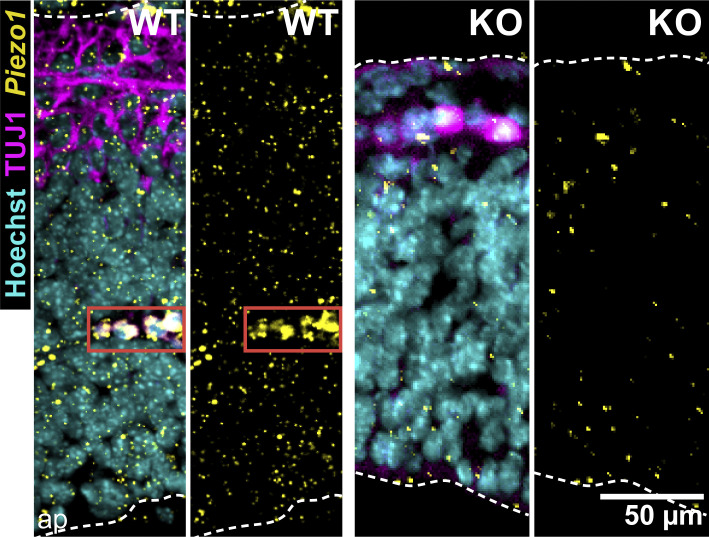
Figure S1.
Fluorescent ISH of Piezo1 mRNA in the E10.5 mouse hindbrain. Representative ISH images of the hindbrain region of WT and Piezo1 KO mutant embryo sections. Piezo1 mRNA shown in yellow, TUJ1 antibody staining of neurons shown in magenta, and Hoechst-stained nuclei in cyan. The white dashed lines demarcate the neuroepithelium, and the red solid box highlights a blood vessel; ap, apical/ventricular border. Images are representative of n = 3 embryos for WT and n = 2 embryos for KO. WT panels are duplicated from Fig. 2 A for reference. Related to Fig. 2 A.

