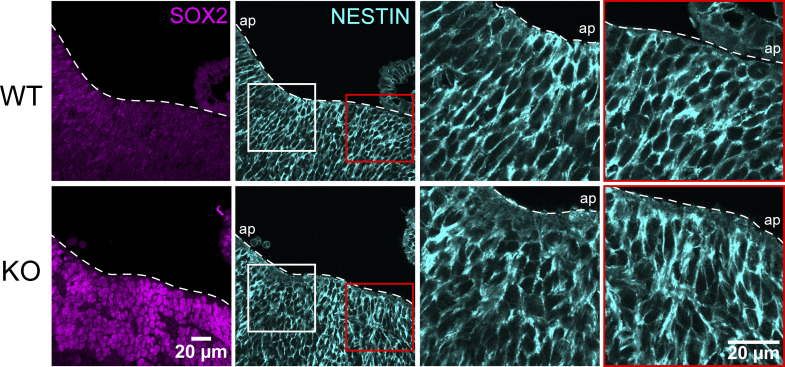
Figure S2.
Piezo1 KO results in a disorganized neuroepithelium in vivo. Representative WT and Piezo1 KO images of the hindbrain region from embryo sections immunostained with SOX2 (magenta) and NESTIN (cyan). The white dashed lines demarcate the neuroepithelial borders; ap, apical/ventricular border. White and red boxed regions in the NESTIN panel are shown at higher magnification on the right. Note the pseudostratified organization of cells along the apical–basal axis in the WT sample, which is disrupted in the Piezo1 KO. Data are representative from n = 3 embryos for WT and n = 3 embryos for Piezo1 KO from two independent experiments. Related to Fig. 2 B.

