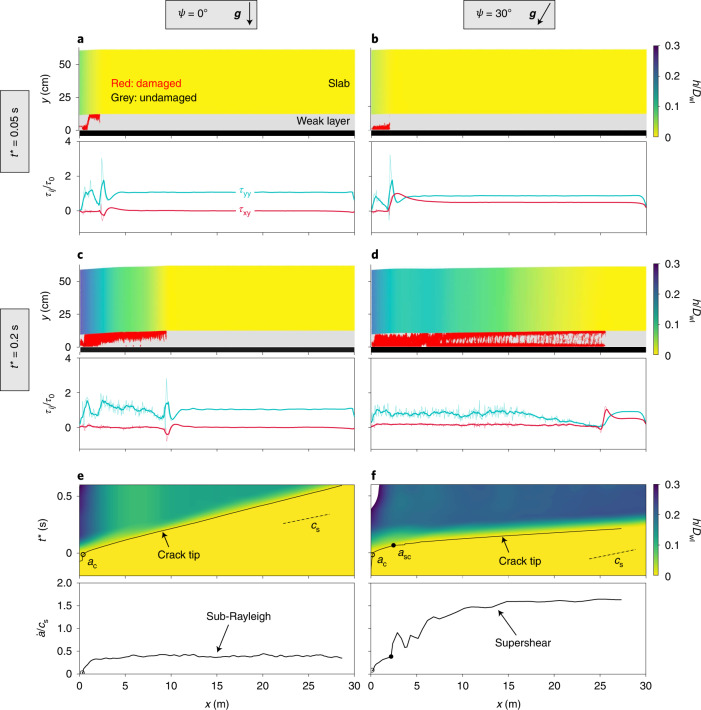
Fig. 1. Crack tip morphology, dynamics and stress state for slopes of 0° and 30°.
a,b, Top: weak layer fracture (in red) and slab vertical displacement h scaled by weak-layer thickness Dwl for ψ = 0° (a) and ψ = 30° (b) Bottom: shear (red) and normal (green) stress profiles in the weak layer. t* = t − tc = 0.05 s (tc is the time corresponding to the onset of crack propagation). c,d, As in a,b, for t* = 0.2 s. e,f, Top: spatio-temporal evolution of h/Dwl and crack tip location for ψ = 0° (e) and ψ = 30° (f). Black solid lines, crack tip position; open circles, critical crack length ac; filled circles, super-critical crack length asc. Bottom: crack propagation speed.

