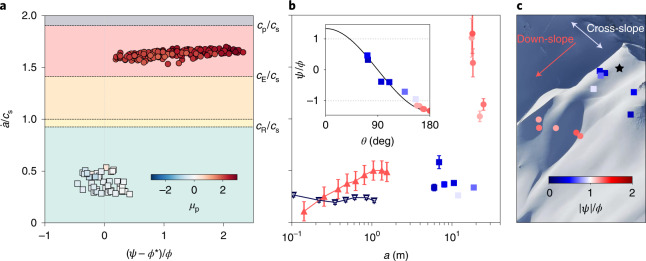
Fig. 4. Crack propagation speed in numerical simulations, field experiments and full-scale measurements.
a, Asymptotic crack speeds obtained in numerical simulations. Points are coloured according to the peak shear-to-normal stress ratio μp. The background colour represents different propagation regimes limited by the Rayleigh wave speed cR, the shear wave speed cs, the Eshelby wave speed and the p-wave speed cp. b, Crack speeds obtained in field experiments (flat PST, dark blue triangles; 37° PST, red triangles) and full-scale avalanche measurements (cross-slope speed, blue squares; down-slope speed, red circles). The determination of error bars is described in the Methods. The inset represents the normalized slope angle versus the azimuthal angle θ, characterizing crack direction (down-slope or cross-slope). c, Location of the measurement points on the slope prior to the avalanche.

