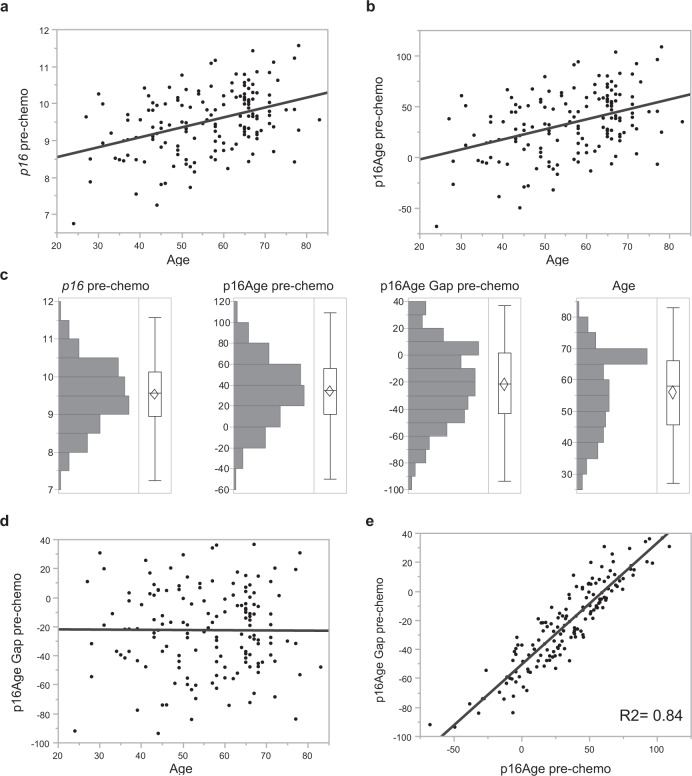
Fig. 1. Expession of p16 mRNA, p16Age, and p16Age Gap prior to chemotherapy.
Correlation between chronological age and expression levels of p16 mRNA (log2) (a), calculated p16Age (b) and p16Age Gap (d) and 16Age and p16Age gap (e). Distribution of p16, p16Age, p16Age Gap and chronological age are summarized in a histogram (c). The histogram shows a bar for grouped values of each continuous variable. The outlier box plot in each graph shows quantiles of continuous distributions. The horizontal line within the box represents the median sample value. The confidence diamond contains the mean and the upper and lower 95% of the mean. p16Age (and therefore log2 p16) is highly correlated with p16Age Gap.

