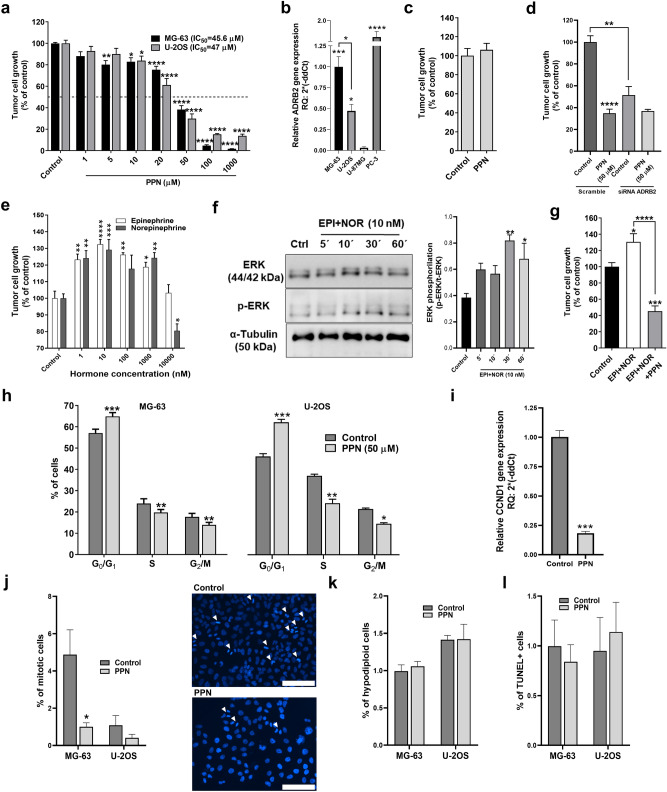
Figure 1.
Direct cytostatic activity of β-blocker propranolol on osteosarcoma cells. Tumor cell growth was evaluated on log-phase growing osteosarcoma (OSA) cells and measured by crystal violet staining after a 72 h exposure to the tested compound. (a) Inhibition of cell growth by propranolol (PPN, 1–1000 µM) on MG-63 and U-2OS cell cultures, and calculation of IC50 values. Statistical significance for PPN in both cell lines was achieved with drug concentrations ≥ than 10 µM. (b) Expression of β2-adrenergic receptor (ADRB2) by OSA cells. ADRB2 mRNA expression levels were evaluated by qRT-PCR in MG-63 and U-2OS OSA cells, human prostate PC-3 cells (positive control expression) and human glioma U-87MG cells (negative control expression). (c) Absence of non-specific effect of PPN in ADRB2-negative U-87MG cells. (d) MG-63 cells were transiently transfected with ADRB2-targeting siRNA (siRNA ADRB2) or non-targeting control siRNA (Scramble). Cells were treated for 72 h with PPN (50 µM) and cellular growth was measured using the crystal violet assay. (e) Stimulation of OSA cell growth by ADRBs agonists epinephrine (EPI) and norepinephrine (NOR) (1–10,000 nM). (f) Western blotting was performed to analyze the impact of EPI and NOR treatment on ERK1/2 signaling pathway in MG-63 cells. Original blots are presented in Fig. S1. (g) Blockage of catecholamines EPI and NOR growth-stimulating effect by coincubation with low dose PPN (10 µM) in MG-63 cells. (h) Cell cycle phase distribution for OSA cells, MG-63 and U-2OS, treated with PPN (50 µM) during 24 h obtained by flow cytometry analysis. (i) Gene expression analysis of cyclin D1 (CCND1) by qRT-PCR in MG-63 cells after 24 h treatment with PPN at 50 µM. (j) Calculation of MG-63 and U-2OS cells in vitro mitotic index was performed on DAPI-stained OSA cell cultures using fluorescence microscopy. Mitotic cells were identified after 48 h PPN treatment in ten HPF of ×400 magnification per experimental group. Representative fluorescent images of vehicle (upper) or PPN (50 µM) treated (lower) OSA cultures showing different mitotic bodies (White arrows). Scale bar = 100 µm. (k) MG-63 and U-2OS cell apoptosis was evaluated as the percentage of cells in the sub-G0/G1-phase, according to their hypodiploid DNA content. (l) % of apoptotic cells in 48 h-treated MG-63 and U-2OS cell cultures were also assessed by TUNEL labeling. Data are presented as mean ± SEM and are representative of at least two or three independent experiments. *p < 0.05, **p < 0.01, ***p < 0.001 and ****p < 0.0001. ANOVA followed by Tukey’s test for (a), (b), (d), (e) and (g), ANOVA followed by Dunnet’s test for (f), unpaired t test for (c), (h), (i), (j) and (k), and χ2 test for (l).

