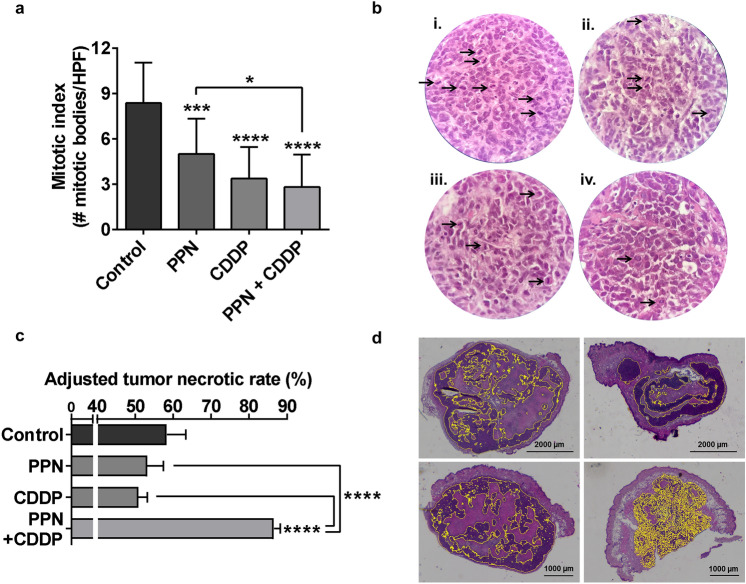
Figure 7.
Histopathological assessment of mitotic index and necrosis in osteosarcoma tumors after treatment. (a) Antimitotic activity of propranolol (PPN) in combination with metronomic cisplatin (CDDP) on osteosarcoma (OSA) xenografts. Quantification of mitotic index in OSA tumor sections from different experimental groups was expressed as the number of mitotic bodies per HPF. (b) Representative images of H&E stained tumor slides belonging to animals treated with i) vehicle, ii) PPN, iii) CDDP or iv) PPN plus CDDP. Arrows show tumor cell mitotic bodies (×400 magnification). (c) % of tumor necrosis in OSA samples was adjusted to tumor volume variation as a response to specific treatments, and was expressed as adjusted tumor necrotic rates. (d) Representative digitally-stitched images of complete tumor sections from vehicle (upper left), PPN (upper right), CDDP (lower left) and PPN plus CDDP (lower right) treatment groups. Yellow lines in tumor slides mark highly basophilic tissue regions belonging to viable malignant tissue. Scale bars = 1000 or 2000 µm. Data are presented as mean ± SEM. *p < 0.05, ***p < 0.001, ****p < 0.0001. ANOVA followed by Tukey’s test.

