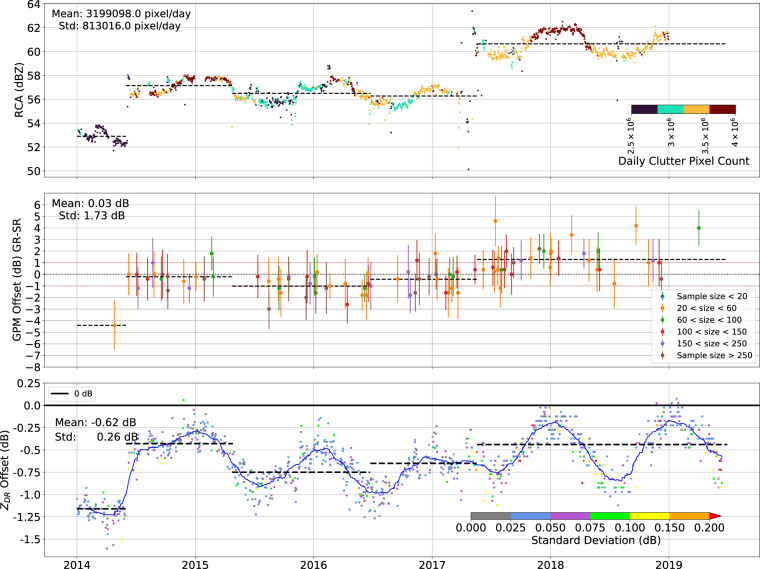
Fig. 2.
Top: Time series of the daily average 95th percentiles of clutter reflectivity. The dashed black lines represent the base line for the selected periods. The colors indicate the daily clutter pixel counts. Middle: Time series of the matched space borne (SR) and ground based radar (GR) reflectivity differences between 2014 and 2019. The colors indicate the number of matched samples and the error bar shows the standard deviation of the reflectivity differences. The dashed black lines represent the mean of all matched points within the chosen time periods. Bottom: Time series of ZDR offsets derived with the birdbath method. The blue line is the moving mean with a 3 months window size and the dashed black lines represent the mean of all points within the chosen time periods. The colors represent the standard deviation of the daily ZDR offset.

