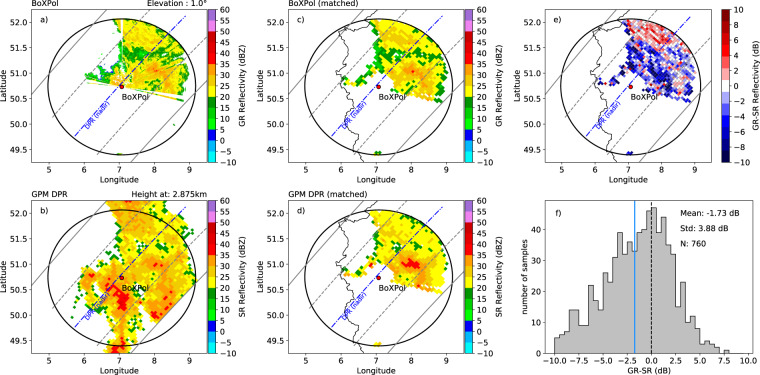
Fig. 3.
Comparison between BoXPol radar and DPR on 2014-10-07, where the nadir beam is indicated with the blue dashed line, the inner swath with the dashed gray lines and the outer swath with the solid gray lines. The reflectivities of the ground-based radar GR (panel a) and of the satellite-based radar SR (panel b), the matched GR (panel c) and SR reflectivity samples (panel d) and the GR-SR reflectivity differences (panel e) of the PPI scan measured at 1° elevation for all individual matched samples are shown. The GR-SR reflectivity difference distribution (panel f) is shown together with the mean, indicated as a blue solid line, standard deviation and number of matched samples. The black dashed line indicates a difference of 0 dB.

