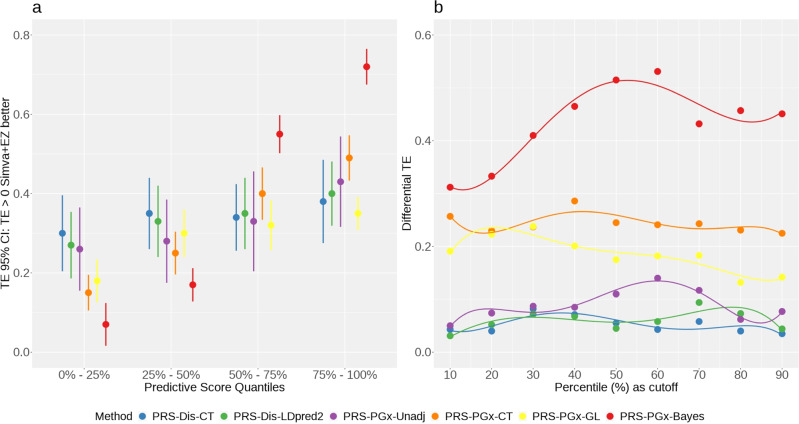
Fig. 4. Patient stratification performance of six polygenic prediction methods in the IMPROVE-IT PGx real data analysis with n = 5661 unrelated European samples.
a Quantile plot of treatment effect using four fixed quantiles (0–25%, 25–50%, 50–75%, and 75–100%). Each dot stands for the observed Treatment Effect (TE), and each bar denotes the 95% Confidence Interval (CI). b Differential treatment effect when patients were stratified into top 10%, 20%, ⋯ , 90% percentile of the predictive score vs. the rest, respectively.

