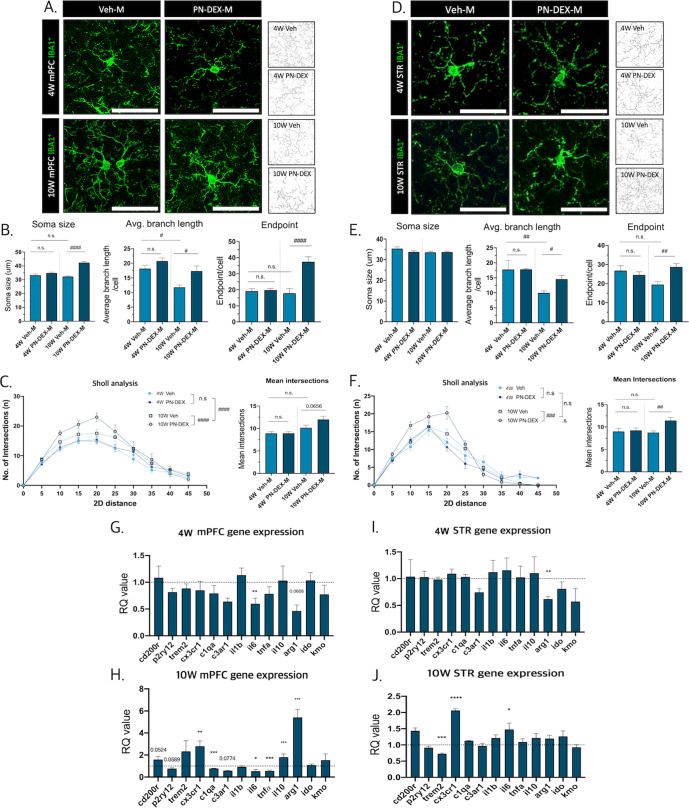
Fig. 2. Maternal dexamethasone exposure induces microglial changes in the mPFC and the striatum of offspring.
A Representative images of the morphology of Iba-1 positive cells in the medial prefrontal cortex (mPFC) according to time point and sex, (40× image, scale bar = 50 µm). B Soma size, branch length, and the number of endpoints in Iba-1 positive cells in the mPFC were calculated. C Sholl analysis indicated that mPFC microglia had a hyper-ramified morphology. D Representative images of the morphology of Iba-1 positive cells in the striatum (STR) according to time point and sex (40× image, scale bar = 50 µm). E Soma size, branch length, and the number of endpoints of Iba-1 positive cells in the STR were calculated. F Sholl analysis showed that striatal microglia had a hyper-ramified morphology. G qRT-PCR analysis to determine gene expression patterns in the mPFC of 4 W PN-DEX-M compared to that of 4 W Veh-M, and (H) the mPFC of 10 W PN-DEX-M compared to that of 10 W Veh-M. I 4 W PN-DEX-M STR, (J) 10 W PN-DEX-M STR. The RQ values are the ratios of the respective genes as a percentage of Veh. Data are presented as mean ± standard error of the mean (SEM). An unpaired t test was used for qRT-PCR; *p < 0.05; **p < 0.01; ***p < 0.001 compared with the Veh-M and Veh-F independently, For morphology analysis, two-way ANOVA followed by Tukey’s post-test was conducted; #p < 0.05; ##p < 0.01; ####p < 0.0001.

