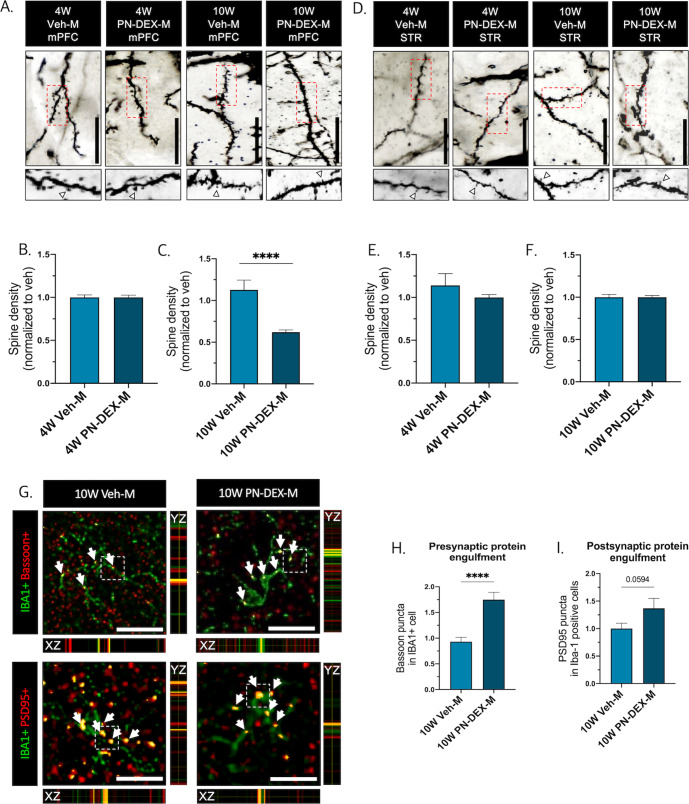
Fig. 4. Increased microglia engulfment of pre-/post-synaptic proteins in the mPFC of 10 W PN-DEX-M.
A Representative images of Golgi staining used to calculate spine density in 4 W and 10 W mPFC. B Spine density of 4 W PN-DEX-M mPFC, and (C) 10 W PN-DEX-M mPFC, normalized to the spine density of Veh-M. D Representative images of Golgi staining used to calculate spine density in 4 W and 10 W STR. E Spine density of 4 W PN-DEX-M STR, and (F) 10 W PN-DEX-M STR, normalized to the spine density of Veh-M. G Representative images of Bassoon (pre-synaptic marker) and PSD95 (post-synaptic) colocalized with Iba-1 positive cells in 10 W mPFC (40× image, scale bar = 25 µm). H, I Quantification of Bassoon and PSD95 puncta in Iba-1 positive cells of 10 W mPFC. Data are presented as mean ± standard error of the mean (SEM), For the purpose of statistical analysis, we conducted an unpaired t test; ***p < 0.001; ****p < 0.0001, compared with the Veh-M.

