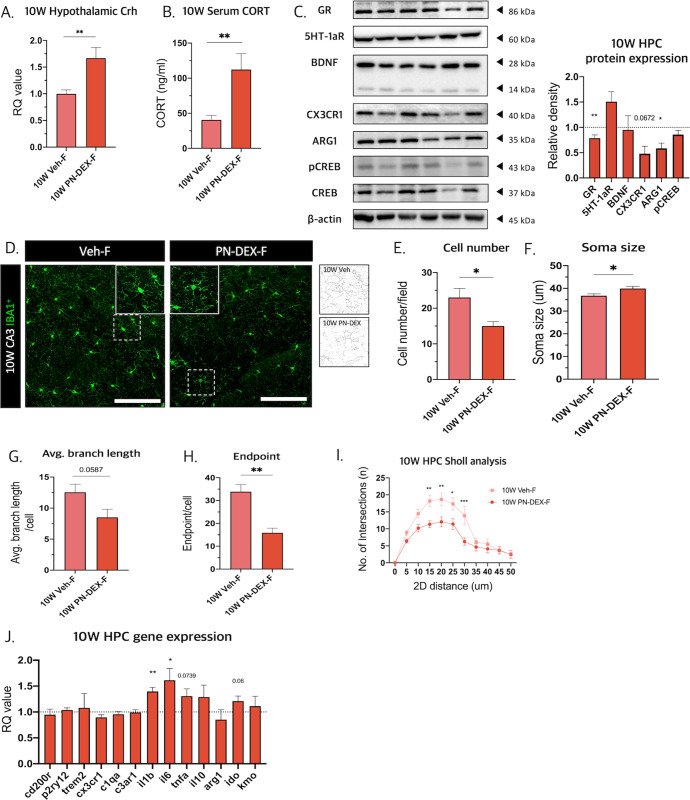
Fig. 6. PN-DEX-F showed HPA-axis activation and inflammatory microglia phenotype in the hippocampus.
A Hypothalamic Crh levels were measured using qRT-PCR. B Serum corticosterone levels were measured using ELISA. C Western blotting was used to assess several proteins related to depression-like behavior. Relative density is defined as the ratio of respective protein density as a percentage of β-actin density. D Representative images of Iba-1 positive cells in CA3 region of the hippocampus and skeletonized images (40× image, scale bar = 50 µm). E Cell number, (F) soma size, (G) branch length, and (H) number of endpoints in the HPC microglia (CA3 and dentate gyrus). I Sholl analysis showed that hippocampal microglia (CA3 and dentate gyrus) displayed de-ramified morphology. J qRT-PCR analysis used to determine gene expression patterns in 10 W PN-DEX-F HPC compared to 10 W Veh-F. Data are expressed as the mean ± standard error of the mean (SEM), and two-way ANOVA followed by Tukey’s post-test. Was conducted; #p < 0.05; ##p < 0.01; ###p < 0.001. For the unpaired t test, *p < 0.05; **p < 0.01, compared with Veh-F.

