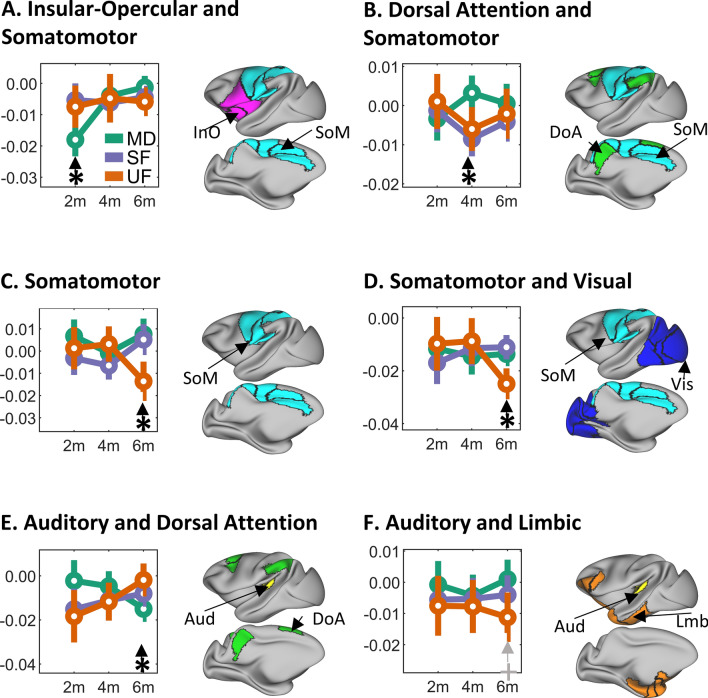
Figure 2.
Functional network pairs with significant differences in functional connectivity for the interaction of group (MD, SF and UF) and age (2 m, 4 m, 6 m). Circles represent the mean functional connectivity and the bar indicates the interquartile range. Each plot indicates the p-value for each individual repeated measures ANOVA test. Each panel also includes a highly inflated projection of the brain cortex with left-lateral and left-medial views indicating the location of the corresponding functional network pairs.

