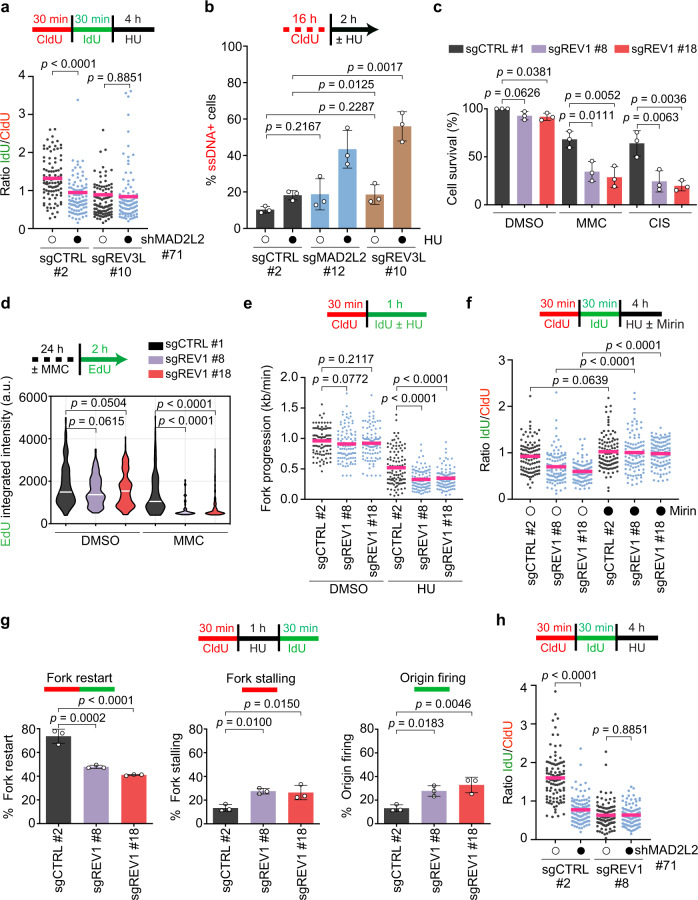
Fig. 6. MAD2L2 activity at stressed replication forks prevents ssDNA accumulation and requires REV3L and REV1.
a Schematic and quantification of fork degradation assays in control (sgCTRL) and REV3L-depleted HeLa cells, transduced with the indicated shRNAs and treated with 4 mM HU for 4 h. b Schematic and quantification of ssDNA-positive cells after CldU labeling for 16 h, followed by mock treatment (open circles) or treatment with 4 mM HU for 2 h (closed circles). Bars represent the mean ± SD of three independent experiments. c Quantification of survival assays in control and REV1-depleted HeLa cells, untreated or treated with 0.5 μΜ MMC or 1 μΜ CIS. Each dot represents one of three independent experiments. d Schematic and quantification of EdU incorporation intensity in control and REV1-depleted HeLa cells, untreated or treated with 5 μΜ MMC for 24 h, followed by EdU labeling for 2 h. White bars represent the median of three independent experiments. e Schematic and quantification of fork progression assays in control and REV1-depleted HeLa cells, untreated or treated with 4 mM HU for 4 h. f Schematic and quantification of fork degradation assays in control and REV1-depleted HeLa cells, treated with 4 mM HU ± 50 μΜ mirin for 4 h. Open circles, no treatment; closed circles, treatment. g Schematic and quantification of fork restart assays in control and REV1-depleted HeLa cells, treated with 4 mM HU for 1 h as indicated. Bars represent the mean ± SD of three independent experiments. h Schematic and quantification of fork degradation assays in control and REV1-depleted HeLa cells transduced with control shRNA (shSCR, open circles) or MAD2L2 shRNA (closed circles). Experimental conditions were similar as in (a). Pink bars in fiber plots represent the mean. Statistical analysis in (a, d, e, f, h) was performed according to two-tailed Mann-Whitney test. A representative fiber experiment from two (h) or three (a, d, e, f) independent biological replicates is shown. Additional replicates and combined fiber plots are provided in the Supplementary Information. Statistical analysis in (b, c, g) was performed according to one-way ANOVA with Dunnett’s multiple comparisons test.

