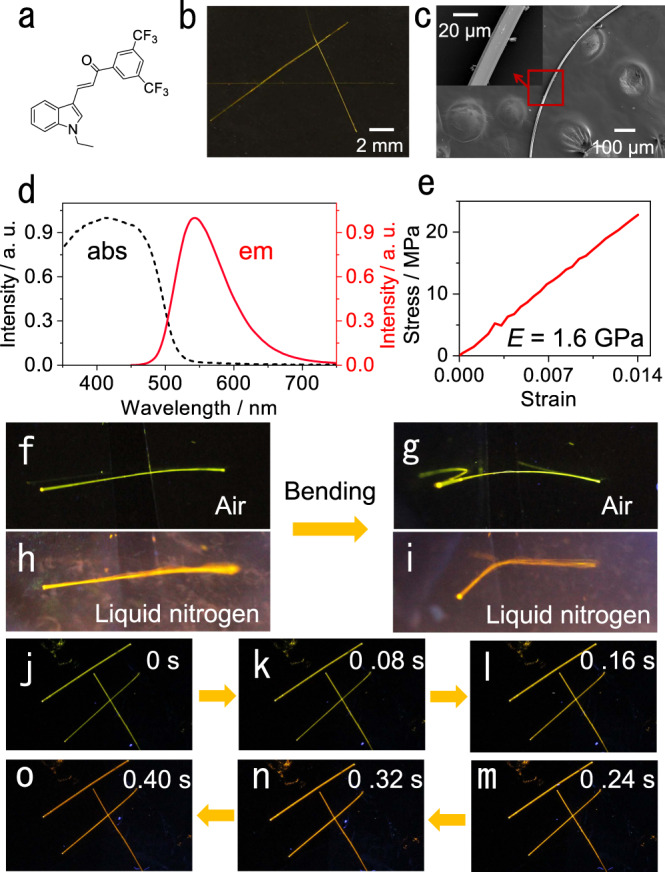
Fig. 1. Structure, elasticity, and fluorescence of compound 1.

a Chemical structure of compound 1. b Photograph of crystals of compound 1 under daylight. c SEM images of a bent crystal. The region in the boxed area is shown as a zoomed-in image in the inset. d Absorption (broken line) and emission (solid line) spectra of crystals of compound 1. e Stress-strain curve of the crystal. f, g Photographs showing crystal bending in air. h, i Photographs showing crystal bending in liquid nitrogen. j–m Change in emission color of the crystals from 298 K to 77 K (the images shown in panels f‒m were recorded under UV light for better contrast).
