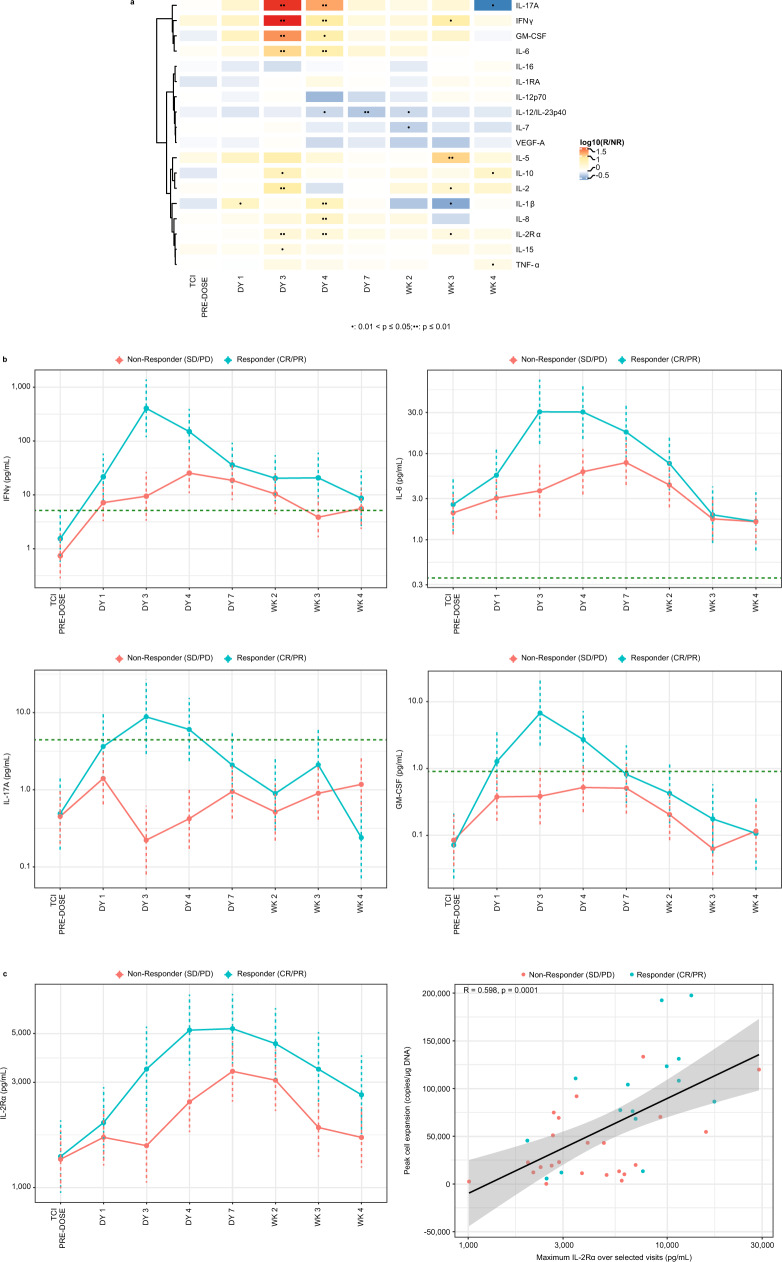
Fig. 5. Increase in proinflammatory cytokines in responders post lete-cel infusion and correlation to peak cell expansion.
a Heatmap of Responder vs Nonresponder ratios in cytokine levels over time obtained from linear mixed effects (LME) model. T-cell infusion (TCI) occurred on Day 0. Nominal p-values from linear effects models were calculated via Wald test and t-distribution and are shown as one dot for 0.01 < p ≤ 0.05 and two dots for p ≤ 0.01. b Time courses of IFNγ, IL-6, IL-17A, and GM-CSF, cytokines differentially upregulated by responders. Geometric means and 95% confidence intervals from LME model (accounting for left-censoring where appropriate) are plotted. Dashed, horizontal lines represented lower limit of quantification. c Time course of soluble IL-2Rα levels showing increase in responders and correlation to peak cell expansion. Line of best fit shown in black and gray area represents 95% confidence bands, both from standard least-squares regression. Sample size varied across timepoints and cytokines, with an overall median of 32 patients (range, 15–38 depending on cytokine/timepoint). For c, Spearman correlation and corresponding two-sided p-value are presented. DY day, GM geometric mean, GM-CSF granulocyte-macrophage colony-stimulating factor, IFN interferon, IL interleukin, WK week.

