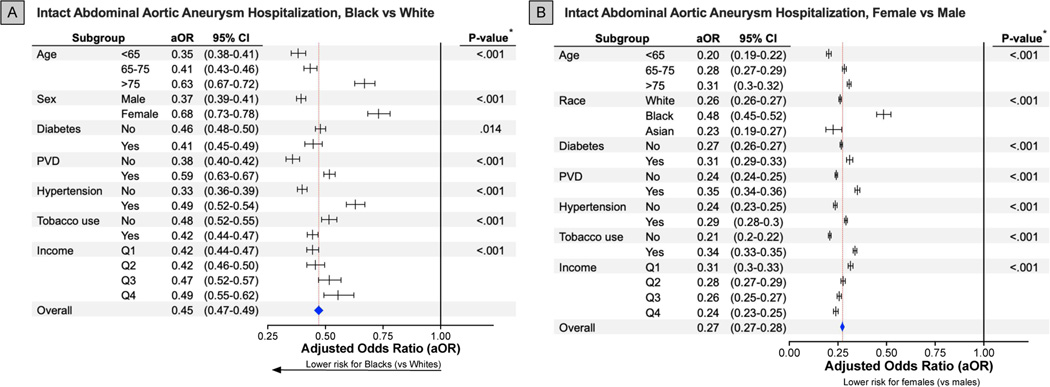
Figure 3. Association Between Intact Abdominal Aortic Aneurysm Hospitalization and Race and Sex Among Subgroups.
* P-value of interaction term comparing between sex and the determined subgroups.
All forest plots visualize adjusted odds ratios and associated 95% confidence intervals for each specific subgroup (lines) and overall (blue diamond; red dashed line). The horizontal black line at an adjusted odds ratio of 1.00 represents an equivalent risk between Black and White (A) or females and males (B).
aOR indicates adjusted odds ratio; 95%CI, 95% confidence interval; PVD, peripheral vascular disease; Q, quartile.

