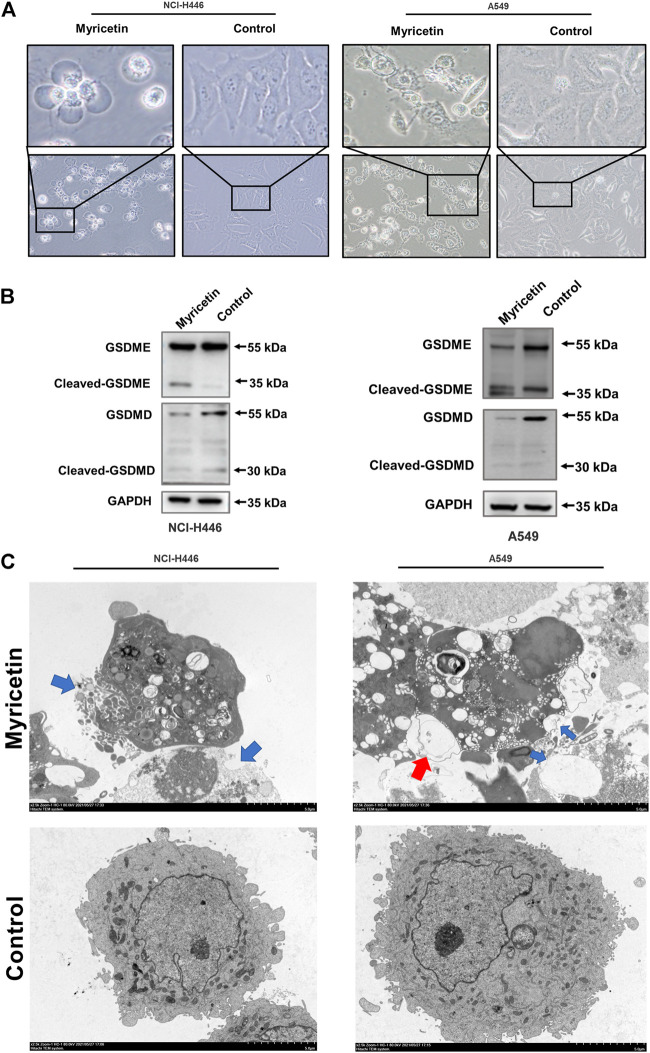
FIGURE 3.
Myricetin induced pyroptosis through GSDME. (A) Microscopic imaging of NCI-H446 and A549 cells after myricetin (150 μM) treatment. (B) Expression of GSDMD and GSDME in NCI-H446 and A549 cells after myricetin (150 μM) treatment. (C) Transmission electron microscopy (The blue arrows refer to the holes formed in the cell membrane, and the red scissors refer to the vacuoles formed in the cell membrane). The blue arrowheads indicate the emerging pores from the plasma membranes.

