Figure 4.
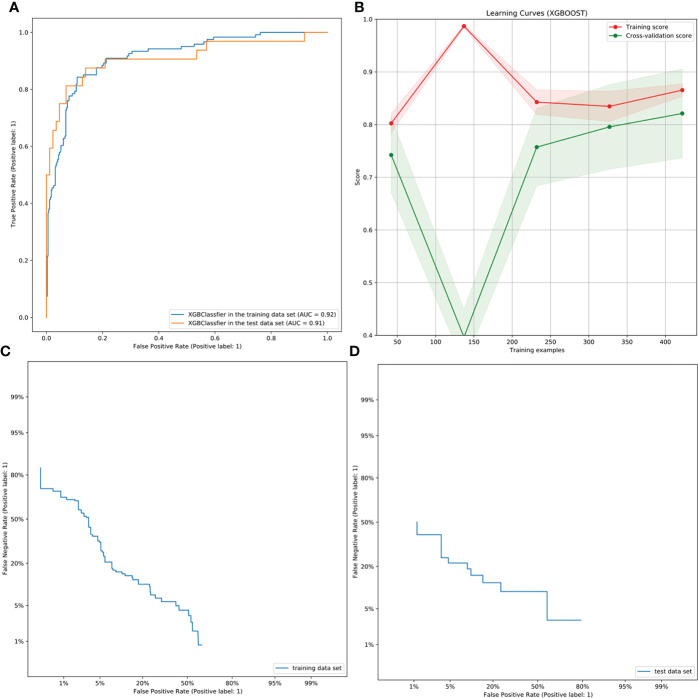
ROC, learning, and DET curves of the XBoost model. (A) The ROC curves of the XGBoost model in the training and test cohorts for predicting CCLNM in PTC patients, with an AUC of 0.9153 and 0.9088, respectively. (B) The learning curve in the training cohort of the XGBoost model. The two curves finally merge near 0.85, indicating that the model is well fitted for training. (C, D) The DET curves of the XGBoost model in the training and test cohorts. They were both concentrated in the third quadrant, indicating that the false rejection rate and false acceptance rate were both low.

