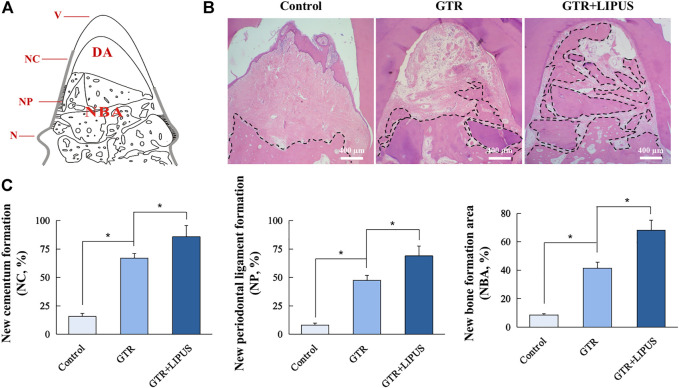
FIGURE 3.
Histological and histomorphometric analyses. (A) Schematic illustration of histomorphometric measurements. N: notch; V: vertex of furcation; NC: new cementum; NC% = NC/NV×100%; NP: new periodontal ligament; NP% = NP/NV×100%; NBA: new bone area; DA: defect area; NBA% = NBA/DA×100%. (B) Representative H&E staining of the furcation area. The dotted lines indicate a new bone formation area. Scale bar, 400 μm. (C) Quantitative analysis of new cementum formation, periodontal ligament formation, and bone formation areas. Data are presented as mean ± SD, *p < 0.05.

