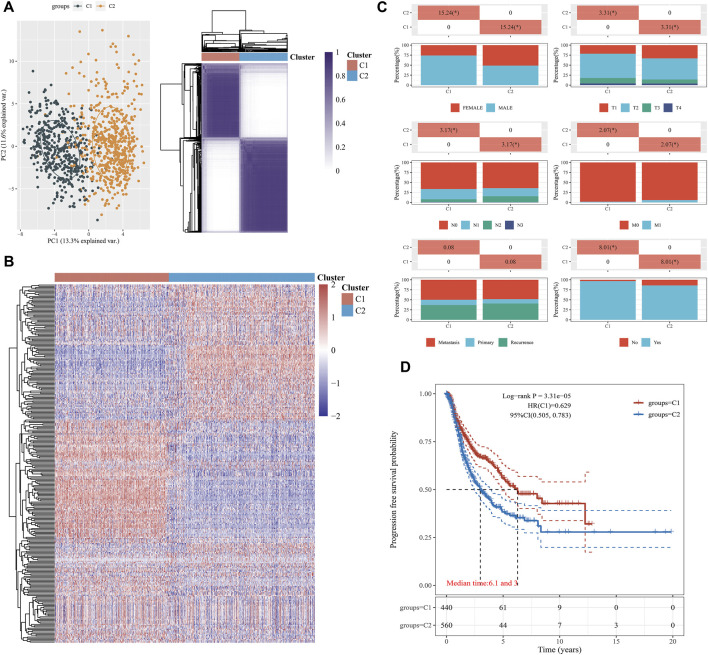
FIGURE 1.
Construction of EMT clusters (C1 and C2) using machine learning algorithms. (A) The principal component analysis (PCA) was applied to explore differences in the expressed genes between the two groups (C1 and C2). Unsupervised clustering was used to classify NSCLC patients into groups (C1 and C2). (B) The heatmap of consistent clustering results shows the expression of EMT in each sample in C1 and C2 groups. Red represents high expression and blue represents low expression. (C) We investigated the distribution of some clinical characteristics in the two groups and analyzed significant p-values by using the chi-square test. (D) Kaplan–Meier survival curve analysis using median patient samples.

